1991 UK local government election
The 1991 Plymouth City Council election took place on 2 May 1991 to elect members of Plymouth City Council in Devon, England. This was on the same day as other local elections . The Labour Party gained control of the council from the Conservative Party, who had held it since its creation in 1973.[ 1]
Overall results 1991 Plymouth City Council Election Party Seats Gains Losses Net gain/loss Seats % Votes % Votes +/− Labour 41 22 0 31.7 43.8 41,401 16.2 Conservative 19 0 12 68.3 33.5 31,669 4.3 Liberal Democrats 0 0 10 0.0 16.7 15,774 14.4 SDP 0 0 0 0.0 6.1 5,767 New Total 60 94,611
Ward results
Location of Budshead ward Budshead (3 seats) Party Candidate Votes % Labour C. Payne 2,752 Labour R. Simmonds 2,744 Labour T. Coleman 2,590 SDP P. Rowe 572 SDP L. Rowe 571 Conservative K. Banks 557 Conservative G. Horler 541 Conservative J. Mahony 523 Liberal Democrats M. Gallagher 394 SDP P. Stanner 389 Liberal Democrats W. Villagio 368 Liberal Democrats S. Hipkiss 345 Turnout 50.9% Labour hold Labour gain from Liberal Democrats Labour hold
Location of Compton ward Compton (3 seats) Party Candidate Votes % Conservative T. Savery 2,232 Conservative P. Wood 2,168 Conservative M. Chapman 2,164 Labour J. Burton 972 Labour H. Watson 963 Labour P. Ingham 963 Liberal Democrats G. Airey 891 Liberal Democrats A. McKelvie 781 Liberal Democrats T. Longworth 738 Turnout 50.6% Conservative hold Conservative hold Conservative hold
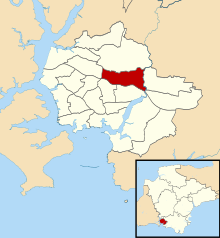
Location of Drake ward Drake (3 seats) Party Candidate Votes % Conservative V. Pengelly 1,891 Labour C. Burgess 1,872 Labour E. Colley 1,830 Labour G. Payne 1,818 Conservative J. Thorpe 1,725 Conservative S. Hole 1,709 Liberal Democrats J. Longworth 743 Liberal Democrats R. Blank 742 Liberal Democrats M. Flippance 724 Turnout 48.8% Conservative hold Labour gain from Conservative Labour gain from Conservative
Location of Efford ward Efford (3 seats) Party Candidate Votes % Labour I. Tuffin 2,679 Labour G. Draper 2,645 Labour H. Welch 2,397 Conservative C. Stanbury 1,637 Conservative K. Banks 1,591 Conservative M. Leaves 1,547 Liberal Democrats R. Vosper 1,427 Liberal Democrats J. Cornish 1,388 Turnout 54.3% Labour hold Labour hold Labour gain from Conservative
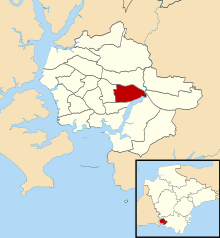
Location of Eggbuckland ward Eggbuckland (3 seats) Party Candidate Votes % Labour D. Bray 2,526 Labour P. Lee 2,347 Labour R. Gachagan 2,273 Conservative J. Pascoe 2,062 Conservative R. Morrell 2,016 Conservative D. Mackinem 1,866 Liberal Democrats A. Nelmes 1,181 Liberal Democrats B. Coe 1,113 Liberal Democrats J. Byatt 975 Turnout 57.7% Labour gain from Conservative Labour gain from Conservative Labour gain from Conservative
Location of Estover ward Estover (3 seats) Party Candidate Votes % Conservative T. Jones 2,285 Conservative V. Hoy 2,249 Conservative K. Wigens 2,217 Labour C. Demuth 1,983 Labour B. Young 1,924 Labour A. Lemin 1,923 SDP R. Goodson 1,080 SDP F. Tapscott 1,077 SDP I. Lucas 990 Turnout 50.1% Conservative hold Conservative hold Conservative hold
Location of Ham ward Ham (3 seats) Party Candidate Votes % Labour B. Rider 2,885 Labour K. Prowse 2,723 Labour T. Evans 2,650 Conservative B. Gibson 742 Conservative Y. Horler 686 Conservative L. Noden 645 SDP D. Mound 584 SDP M. Yardley 580 Turnout 51.2% Labour hold Labour hold Labour hold
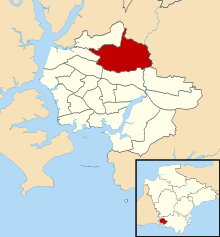
Location of Honicknowle ward Honicknowle (3 seats) Party Candidate Votes % Labour J. Ingham 3,440 Labour P. Whitfield 3,372 Labour R. Burton 3,118 Conservative J. Brimacombe 967 Conservative E. Hughes 893 Conservative J. Wallace 886 Liberal Democrats M. Evens 733 SDP P. Murphy 435 SDP B. Tapscott 409 Turnout 52.8% Labour hold Labour hold Labour hold
Location of Keyham ward Keyham (3 seats) Party Candidate Votes % Labour M. Sheaff 2,019 Labour R. Lemin 1,979 Labour T. Smith 1,913 SDP H. Furzeman 1,506 SDP I. Higgins 1,432 SDP L. Woodcock 1,425 Conservative M. Derbyshire 753 Conservative M. Orchard 654 Conservative R. Williams 628 Turnout 52.0% Labour gain from Liberal Democrats Labour gain from Liberal Democrats Labour gain from Liberal Democrats
Location of Mount Gould ward Mount Gould (3 seats) Party Candidate Votes % Labour V. Grout 1,960 Labour A. Hall 1,941 Labour P. Coyle 1,897 Conservative B. Carter 1,163 Conservative H. George 1,117 Conservative J. Kingdom 1,112 Liberal Democrats A. Cameron 727 Liberal Democrats S. Knight 557 Liberal Democrats K. Robinson 529 Turnout 50.2% Labour gain from Liberal Democrats Labour gain from Liberal Democrats Labour gain from Liberal Democrats
Location of Plympton Erle ward Plympton Erle (3 seats) Party Candidate Votes % Conservative J. Mills 2,297 Conservative A. Wright 2,227 Conservative J. Richards 2,227 Liberal Democrats L. Howorth 1,446 Liberal Democrats M. Williams 1,421 Liberal Democrats J. Peacock 1,409 Labour V. Burns 1,374 Labour J. Williams 1,306 Labour A. Dymond 1,250 Turnout 44.9% Conservative hold Conservative hold Conservative hold
Location of Plympton St Mary ward Plympton St Mary (3 seats) Party Candidate Votes % Conservative J. Stopporton 2,421 Conservative O. Hughes 2,265 Conservative Gary Streeter 2,250 Liberal Democrats G. Morris 1,625 Liberal Democrats P. Howard 1,545 Liberal Democrats C. Rendle 1,488 Labour D. Mills 996 Labour P. Smith 957 Labour T. Nally 956 Turnout 54.8% Conservative hold Conservative hold Conservative hold
Location of Plymstock Dunstone ward Plymstock Dunstone (3 seats) Party Candidate Votes % Conservative D. Dicker 2,948 Conservative P. Hocken 2,843 Conservative D. Viney 2,758 Liberal Democrats C. Forte 1,317 Liberal Democrats S. Harding 1,299 Liberal Democrats G. Unwin 1,264 Labour H. Biles 1,142 Labour W. Smale 1,049 Labour T. Woodman 961 Turnout 52.7% Conservative hold Conservative hold Conservative hold
Location of Plymstock Radford ward Plymstock Radford (3 seats) Party Candidate Votes % Conservative C. Easton 2,348 Conservative I. Bowyer 1,954 Conservative K. Moyse 1,953 Labour R. Earl 1,310 Labour P. Allan 1,217 Labour J. Nicholson 1,132 Liberal Democrats B. Grundy 1,000 Liberal Democrats W. Maddick 898 Liberal Democrats A. Dudson 874 Turnout 53.3% Conservative hold Conservative hold Conservative hold
Location of Southway ward Southway (3 seats) Party Candidate Votes % Labour W. Ainsworth 2,989 Labour D. Camp 2,940 Labour J. Jones 2,874 Conservative M. Gibson 1,111 Conservative A. Marshall-Clarke 1,004 Liberal Democrats J. Benson 1,003 Conservative A. Sloggett 945 Turnout 47.3% Labour hold Labour hold Labour hold
Location of St Budeax ward St Budeax (3 seats) Party Candidate Votes % Labour W. Wraight 2,109 Labour J. Coyle 2,093 Labour J. Payne 2,030 SDP H. Luscombe 1,590 SDP A. Ford 1,152 Conservative E. Deacon 801 Liberal Democrats W. Gallagher 770 Conservative M. Campbell 684 Conservative F. Sullivan 681 Turnout 52.1% Labour gain from Liberal Democrats Labour gain from Liberal Democrats Labour gain from Liberal Democrats
Location of St Peter ward St Peter (3 seats) Party Candidate Votes % Labour S. Bellamy 2,190 Labour P. Kelly 2,087 Labour M. Riggs 2,076 Conservative J. Parry 718 Conservative C. Robinson 691 Conservative P. Smith 625 Liberal Democrats J. Bristow-Watson 453 Liberal Democrats D. Charlesworth 427 Liberal Democrats P. York 405 Turnout 44.4% Labour hold Labour hold Labour hold
Location of Stoke ward Stoke (3 seats) Party Candidate Votes % Labour D. Millar 2,031 Labour T. Martin 2,025 Labour J. Millar 1,937 Conservative P. Nicholson 1,818 Conservative C. Pascoe 1,815 Conservative G. Monahan 1,613 Liberal Democrats J. Dean 1,146 Liberal Democrats J. Evans 1,074 Liberal Democrats P. York 983 Turnout 52.2% Labour gain from Conservative Labour gain from Conservative Labour gain from Conservative
Location of Sutton ward Sutton (3 seats) Party Candidate Votes % Labour J. Finnigan 2,265 Labour J. Nelder 2,123 Labour C. Mavin 2,084 Conservative F. Brimacombe 1,121 Conservative J. Ellis 953 Conservative M. Greenhalgh 836 Liberal Democrats G. Pedrick 484 Liberal Democrats P. Jones 480 Liberal Democrats S. Longworth 469 Turnout 50.3% Labour hold Labour hold Labour hold
Location of Trelawny ward Trelawny (3 seats) Party Candidate Votes % Labour C. Brimblecombe 1,907 Labour J. Blower 1,902 Labour H. Davey 1,873 Conservative D. Ackland 1,797 Conservative P. Nicholson 1,778 Conservative V. Williams 1,754 Liberal Democrats M. Hazell 434 Liberal Democrats S. Guy 415 Liberal Democrats S. McConnell 401 Turnout 62.8% Labour gain from Conservative Labour gain from Conservative Labour gain from Conservative
References ^ a b Rallings, Colin; Thrasher, Michael. Local Elections Handbook 1991 (PDF) . Plymouth University, Plymouth, UK: The Elections Centre. p. 9.

 22
22  12
12 


 Council elections in Devon


