2017 UK local government election
2017 Devon County Council election
|
|
All 60 seats to Devon County Council
31 seats needed for a majority |
|---|
| | First party | Second party | Third party | | | | | | | Party | Conservative | Liberal Democrats | Labour | | Last election | 38 seats, 35.3% | 9 seats, 16.0% | 7 seats, 13.2% | | Seats before | 38 | 9 | 7 | | Seats won | 42 | 7 | 7 | | Seat change |  4 4 |  2 2 |  | | Popular vote | 98,278 | 48,022 | 33,571 | | Percentage | 44.4% | 21.7% | 15.2% |
| | | Fourth party | Fifth party | Sixth party | | | | | | | Party | Independent | Green | UKIP | | Last election | 3 seats, 5.6% | 1 seat, 6.5% | 4 seats, 23.0% | | Seats before | | 1 | 4 | | Seats won | 3 [Note 1] | 1 | 0 | | Seat change | | | 4 | | Popular vote | 21,336 | 11,928 | 9,629 | | Percentage | 9.6% | 5.4% | 4.4% | |
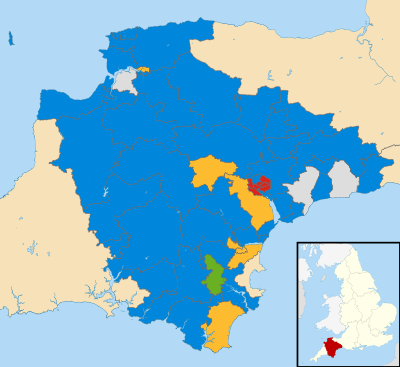 Map of the results of the 2017 Devon council election. |
Council control before election
Conservative
| Council control after election
Conservative
| |
The 2017 Devon County Council election took place on 4 May 2017 as part of the 2017 local elections in the United Kingdom.[1] All 60 councillors were elected from 58 electoral divisions, which returned either one or two county councillors each by first-past-the-post voting for a four-year term of office.
Boundary changes to the electoral divisions took effect at this election after a review of the county by the Local Government Boundary Commission for England.[2][3]
Election result by division
Alphington and Cowick
Alphington and Cowick[4] | Party | Candidate | Votes | % | ±% |
| | Labour | Yvonne Atkinson | 1,980 | 43.3 | +8.4 |
| | Conservative | Alex Traves | 1,558 | 34.1 | +20.6 |
| | Liberal Democrats | Rod Ruffle | 617 | 13.5 | −12.9 |
| | Green | Andrew Wallace Bell | 280 | 6.1 | +1.4 |
| | UKIP | Dutch Dudgeon | 126 | 2.8 | −17.5 |
| Majority | 422 | 9.2 | +0.7 |
| Turnout | 4,572 | 41.4 | +8.9 |
| | Labour hold | Swing | | |
Ashburton and Buckfastleigh
Ashburton and Buckfastleigh[5] | Party | Candidate | Votes | % | ±% |
| | Conservative | Stuart Denis Barker | 1,489 | 36.4 | −0.2 |
| | Liberal Democrats | John Nutley | 1,466 | 35.9 | +23.3 |
| | Independent | Ronald Edward Paul Fox | 666 | 16.3 | N/A |
| | Labour | Helen Lorna McGechie | 342 | 8.4 | −4.2 |
| | UKIP | Bruce Andrew Meechan | 113 | 2.8 | −17.6 |
| Majority | 23 | 0.6 | −15.6 |
| Turnout | 4,087 | 41.6 | +8.1 |
| | Conservative hold | Swing | | |
Axminster
Axminster[6] | Party | Candidate | Votes | % | ±% |
| | Conservative | Ian L Hall | 1,741 | 47.1 | N/C |
| | East Devon Alliance | Paul G Hayward | 1,322 | 35.8 | +4.7 |
| | Liberal Democrats | Bill Foster | 320 | 8.7 | −0.2 |
| | Labour | Jeremy W Walden | 306 | 8.3 | +1.9 |
| Majority | 419 | 11.3 | −10.4 |
| Turnout | 3,693 | 39.5 | +3.3 |
| | Conservative hold | Swing | | |
Barnstaple North
Barnstaple North[7] | Party | Candidate | Votes | % | ±% |
| | Liberal Democrats | Brian Carol Greenslade | 1,759 | 52.7 | +22.2 |
| | Conservative | David William Hoare | 780 | 23.4 | +2.0 |
| | Labour | Roy Ernest Tomlinson | 304 | 9.1 | +0.8 |
| | UKIP | Andy Norden | 252 | 7.5 | −11.7 |
| | Green | Ricky Knight | 238 | 7.1 | −9.6 |
| Majority | 979 | 29.3 | +20.2 |
| Turnout | 3,338 | 31.8 | +2.9 |
| | Liberal Democrats hold | Swing | | |
Barnstaple South
Barnstaple South[8] | Party | Candidate | Votes | % | ±% |
| | Conservative | John Vincent Mathews | 1,585 | 44.6 | +13.0 |
| | Liberal Democrats | David Nigel Chalmers | 1,215 | 34.2 | +6.9 |
| | Labour | Laurence Overend | 344 | 9.7 | +0.3 |
| | UKIP | Steve Crowther | 228 | 6.4 | −18.7 |
| | Green | Matt Chamings | 178 | 5.0 | −1.1 |
| Majority | 370 | 10.4 | +6.1 |
| Turnout | 3,555 | 34.6 | +5.2 |
| | Conservative hold | Swing | | |
Bickleigh and Wembury
Bickleigh and Wembury[9] | Party | Candidate | Votes | % | ±% |
| | Conservative | John Hart | 2,276 | 71.4 | +11.8 |
| | Labour | John Harvey | 360 | 11.3 | N/A |
| | Liberal Democrats | Caroline Voaden | 304 | 9.5 | −1.6 |
| | Green | Coral Smith | 236 | 7.4 | N/A |
| Majority | 1,916 | 60.1 | +28.9 |
| Turnout | 3,186 | 34.1 | +4.4 |
| | Conservative hold | Swing | | |
Bideford East
Bideford East[10] | Party | Candidate | Votes | % | ±% |
| | Conservative | Linda Joan Hellyer | 938 | 29.9 | +0.6 |
| | Labour Co-op | David George Brenton | 626 | 19.9 | +0.2 |
| | Independent | Phil Pennington | 546 | 17.4 | N/A |
| | UKIP | Sam Robinson | 444 | 14.1 | −16.4 |
| | Liberal Democrats | Robert Ivor Wootton | 311 | 9.9 | −4.0 |
| | Green | Will Douglas-Mann | 189 | 6.0 | −0.2 |
| | No description | Stephen Barnes | 78 | 2.5 | N/A |
| Majority | 312 | 10.0 | |
| Turnout | 3,139 | 31.6 | +4.7 |
| | Conservative gain from UKIP | Swing | | |
Bideford West and Hartland
Bideford West and Hartland[11] | Party | Candidate | Votes | % | ±% |
| | Conservative | Tony Inch | 1,223 | 42.4 |
| | UKIP | Robin Julian | 589 | 20.4 |
| | Liberal Democrats | Stephen Potts | 556 | 19.3 |
| | Labour | Anne Brenton | 509 | 17.6 |
| Majority | 634 | 22.0 |
| Turnout | 2,886 | 32.3 |
| | Conservative win (new seat) |
Bovey Rural
Bovey Rural[12] | Party | Candidate | Votes | % | ±% |
| | Conservative | George John Gribble | 2,149 | 49.9 | +3.0 |
| | Liberal Democrats | Sally Angela Morgan | 1,365 | 31.7 | +17.4 |
| | Labour | Lisa Collette Robillard Webb | 307 | 7.1 | −4.3 |
| | Independent | Eoghan Eamon Kelly | 194 | 4.5 | N/A |
| | Green | Roger Haworth | 166 | 3.9 | −1.3 |
| | UKIP | Graham John Walker | 118 | 2.7 | −19.4 |
| Majority | 784 | 18.2 | −6.6 |
| Turnout | 4,304 | 43.7 | +4.3 |
| | Conservative hold | Swing | | |
Braunton Rural
Braunton Rural[13] | Party | Candidate | Votes | % |
| | Conservative | Caroline Jean Chugg | 1,479 | 40.7 |
| | Liberal Democrats | Liz Spear | 1,219 | 33.5 |
| | Labour | Mark Michael Robert Cann | 670 | 18.4 |
| | UKIP | Rob McConnell | 247 | 6.8 |
| Majority | 260 | 7.2 |
| Turnout | 3,634 | 38.9 |
| | Conservative hold |
Broadclyst
Broadclyst (2 seats)[14] | Party | Candidate | Votes | % |
| | Conservative | Ray Bloxham | 1,652 | 48.0 |
| | Conservative | Sara M Randall Johnson | 1,516 | 44.1 |
| | Liberal Democrats | Eleanor A C Rylance | 839 | 24.4 |
| | Green | Henry F Gent | 679 | 19.7 |
| | Liberal Democrats | Peter M Hook | 515 | 15.0 |
| | Labour | Jan Ross | 411 | 12.0 |
| | Labour | Sue Mills | 406 | 11.8 |
| | Independent | Eileen Lascelles | 359 | 10.4 |
| Turnout | 3,454 | 45.7 |
| | Conservative win (new seat) |
| | Conservative win (new seat) |
- Two councillors elected for this division
Chudleigh and Teign Valley
Chudleigh and Teign Valley[15] | Party | Candidate | Votes | % |
| | Conservative | Jerry Brook | 2,044 | 49.6 |
| | Liberal Democrats | Richard Michael Keeling | 1,553 | 37.7 |
| | Labour | Anthony Krys | 288 | 7.0 |
| | Green | Katie Anne Reville | 226 | 5.5 |
| Majority | 491 | 11.9 |
| Turnout | 4,120 | 40.9 |
| | Conservative win (new seat) |
Chulmleigh and Landkey
Chulmleigh and Landkey[16] | Party | Candidate | Votes | % |
| | Conservative | Richard Colin Edgell | 1,849 | 59.0 |
| | Liberal Democrats | David John Worden | 884 | 28.2 |
| | Green | Lucie Catherine Puttipap | 200 | 6.4 |
| | Labour | Marion Elizabeth Mason | 194 | 6.2 |
| Majority | 965 | 30.8 |
| Turnout | 3,132 | 41.3 |
| | Conservative win (new seat) |
Combe Martin Rural
Combe Martin Rural[17] | Party | Candidate | Votes | % |
| | Conservative | Andrea Vivienne Davis | 2,278 | 63.1 |
| | Liberal Democrats | Sue Haywood | 562 | 15.6 |
| | Labour | Oliver John Leslie Bell | 308 | 8.5 |
| | Green | Kyle James Chivers | 290 | 8.0 |
| | UKIP | Jon Irving-Bell | 165 | 4.6 |
| Majority | 1,716 | 47.5 |
| Turnout | 3,609 | 37.0 |
| | Conservative hold |
Crediton
Crediton[18] | Party | Candidate | Votes | % |
| | Liberal Democrats | Nick Way | 2,093 | 48.8 |
| | Conservative | Clive Eginton | 1,679 | 39.1 |
| | Labour | Susan Macrow-Hill | 271 | 6.3 |
| | UKIP | Mike Szabo | 238 | 5.5 |
| Majority | 414 | 9.7 |
| Turnout | 4,289 | 43.2 |
| | Liberal Democrats hold |
Creedy Taw and Mid Exe
Creedy Taw and Mid Exe[19] | Party | Candidate | Votes | % |
| | Conservative | Margaret Squires | 2,622 | 53.4 |
| | Liberal Democrats | Frank William Letch | 1,194 | 24.3 |
| | Labour | John Ross | 402 | 8.2 |
| | Green | Paul Anthony Edwards | 310 | 6.3 |
| | UKIP | Tim Matthews | 262 | 5.3 |
| Majority | 1,428 | 29.1 |
| Turnout | 4,914 | 45.7 |
| | Conservative win (new seat) |
Cullompton and Bradninch
Cullompton and Bradninch[20] | Party | Candidate | Votes | % |
| | Conservative | John Berry | 1,499 | 44.3 |
| | Liberal Democrats | Luke Daniel Taylor | 810 | 24.0 |
| | Independent | David Follett Pugsley | 478 | 14.1 |
| | Labour | Danny Barnes | 332 | 9.8 |
| | UKIP | William Oliver Jones | 185 | 5.5 |
| | Green | Gillian Margaret Westcott | 70 | 2.1 |
| Majority | 689 | 20.4 |
| Turnout | 3,380 | 35.4 |
| | Conservative win (new seat) |
Dartmouth and Marldon
Dartmouth and Marldon[21] | Party | Candidate | Votes | % |
| | Conservative | Jonathan Hawkins | 2,292 | 66.3 |
| | Liberal Democrats | Susie Jackson | 456 | 13.2 |
| | Green | Heather Nicholson | 360 | 10.4 |
| | Labour | Tessa Lannin | 344 | 9.9 |
| Majority | 1,836 | 53.1 |
| Turnout | 3,459 | 36.1 |
| | Conservative win (new seat) |
Dawlish
Dawlish[22] | Party | Candidate | Votes | % |
| | Conservative | John Clatworthy | 2,407 | 51.8 |
| | Liberal Democrats | Martin Wrigley | 1,479 | 31.9 |
| | Labour Co-op | Christina Doyle | 453 | 9.8 |
| | UKIP | David Antony Gunn | 300 | 6.5 |
| Majority | 928 | 20.0 |
| Turnout | 4,643 | 39.5 |
| | Conservative hold |
Duryard and Pennsylvania
Duryard and Pennsylvania[23] | Party | Candidate | Votes | % |
| | Conservative | Percy Prowse | 1,666 | 46.8 |
| | Labour | Jane Begley | 1,130 | 31.8 |
| | Liberal Democrats | Michael Norman Mitchell | 488 | 13.7 |
| | Green | Lizzie Woodman | 204 | 5.7 |
| | UKIP | Sallie Cherie Waters | 65 | 1.8 |
| Majority | 536 | 15.1 |
| Turnout | 3,557 | 47.5 |
| | Conservative hold |
Exminster and Haldon
Exminster and Haldon[24] | Party | Candidate | Votes | % |
| | Liberal Democrats | Alan Michael Connett | 2,130 | 51.5 |
| | Conservative | Kevin Andrew Lake | 1,510 | 36.5 |
| | Green | Andy Bragg | 212 | 5.1 |
| | Labour | Sarah Elizabeth Krys | 198 | 4.8 |
| | UKIP | Bob Edwards | 82 | 2.0 |
| Majority | 620 | 15.0 |
| Turnout | 4,135 | 46.7 |
| | Liberal Democrats win (new seat) |
Exmouth
Exmouth (2 seats)[25] | Party | Candidate | Votes | % |
| | Conservative | Richard Scott | 2,849 | 35.6 |
| | Conservative | Jeff Trail | 2,725 | 34.0 |
| | Independent | Ben Ingham | 2,199 | 27.5 |
| | Liberal Democrats | Eileen E Wragg | 2,117 | 26.4 |
| | Liberal Democrats | Tim Dumper | 1,719 | 21.5 |
| | UKIP | Brigitte Graham | 799 | 10.0 |
| | Green | Robert N Masding | 755 | 9.4 |
| | Labour | Dilys Hadley | 700 | 8.7 |
| | Green | Oliver Davey | 692 | 8.6 |
| | Labour | Pete Money | 645 | 8.1 |
| Turnout | 8,013 | 31.4 |
| | Conservative win (new seat) |
| | Conservative win (new seat) |
- Two councillors elected for this division
Exmouth and Budleigh Salterton Coastal
Exmouth and Budleigh Salterton Coastal[26] | Party | Candidate | Votes | % |
| | Conservative | Christine Channon | 2,456 | 54.7 |
| | Liberal Democrats | Steve Gazzard | 960 | 21.4 |
| | Labour | Keith Edwards | 448 | 10.0 |
| | UKIP | Gavin Graham | 277 | 6.2 |
| | Green | Mike Rosser | 246 | 5.5 |
| | Liberal | Harry J Tribble | 87 | 1.9 |
| Majority | 1,496 | 33.3 |
| Turnout | 4,491 | 38.5 |
| | Conservative win (new seat) |
Exwick and St. Thomas
Exwick and St. Thomas[27] | Party | Candidate | Votes | % |
| | Labour | Rob Hannaford | 2,089 | 57.3 |
| | Conservative | Azhar-Jamal Chaudhry | 776 | 21.3 |
| | Green | Joe Levy | 311 | 8.5 |
| | Liberal Democrats | Christine Vince | 241 | 6.6 |
| | UKIP | Lawrence Simon Harper | 216 | 5.9 |
| Majority | 1,313 | 36.0 |
| Turnout | 3,644 | 36.1 |
| | Labour hold |
Feniton and Honiton
Feniton and Honiton[28] | Party | Candidate | Votes | % |
| | Conservative | Phil Twiss | 1,879 | 61.1 |
| | Labour | Andrew V Blackwell | 543 | 17.7 |
| | Liberal Democrats | David N Cox | 371 | 12.1 |
| | UKIP | Graham L Smith | 269 | 8.8 |
| Majority | 1,336 | 43.5 |
| Turnout | 3,073 | 27.1 |
| | Conservative win (new seat) |
Fremington Rural
Fremington Rural[29] | Party | Candidate | Votes | % |
| | Independent | Frank Lindsay Biederman | 2,202 | 55.8 |
| | Conservative | Rodney Sheridan | 1,108 | 28.1 |
| | Liberal Democrats | Julie Sheelagh Adnams Hatch | 327 | 8.3 |
| | Labour | Ian Crawford | 124 | 3.1 |
| | UKIP | Pauline Lesley Davies | 101 | 2.6 |
| | Green | Phillip Wearne | 76 | 1.9 |
| Majority | 1,094 | 27.7 |
| Turnout | 3,943 | 45.6 |
| | Independent hold |
Hatherleigh and Chagford
Hatherleigh and Chagford[30] | Party | Candidate | Votes | % |
| | Conservative | James Raymond McInnes | 2,615 | 62.6 |
| | Liberal Democrats | Ross Anthony Wolverson | 543 | 13.0 |
| | Green | David Osbiston | 444 | 10.6 |
| | Labour | Paula Louise Frisby | 384 | 9.2 |
| | UKIP | Bob Rush | 190 | 4.5 |
| Majority | 2,072 | 49.6 |
| Turnout | 4,179 | 40.8 |
| | Conservative hold |
Heavitree and Whipton Barton
Heavitree and Whipton Barton[31] | Party | Candidate | Votes | % |
| | Labour | Emma Brennan | 2,151 | 51.2 |
| | Conservative | Emily Jane Croft | 1,317 | 31.4 |
| | Liberal Democrats | Gerald Pryke | 283 | 6.7 |
| | Green | Kay Powell | 249 | 5.9 |
| | UKIP | Robert James Sheridan | 192 | 4.6 |
| Majority | 834 | 19.9 |
| Turnout | 4,200 | 41.0 |
| | Labour hold |
Holsworthy Rural
Holsworthy Rural[32] | Party | Candidate | Votes | % |
| | Conservative | Barry Michael Parsons | 3,185 | 67.2 |
| | Liberal Democrats | Caroline Frances Herringham Leaver | 574 | 12.1 |
| | UKIP | Nigel Andrew Johnson | 536 | 11.3 |
| | Labour | Vivian George Gale | 439 | 9.3 |
| Majority | 2,611 | 55.0 |
| Turnout | 4,743 | 38.4 |
| | Conservative hold |
Ilfracombe
Ilfracombe[33] | Party | Candidate | Votes | % |
| | Conservative | Paul Edward Crabb | 1,173 | 38.1 |
| | Green | Netti Pearson | 822 | 26.7 |
| | Independent | Mike Edmunds | 704 | 22.9 |
| | Labour | Toby Ebert | 256 | 8.3 |
| | UKIP | Stuart Robertson | 122 | 4.0 |
| Majority | 351 | 11.4 |
| Turnout | 3,078 | 34.9 |
| | Conservative gain from Independent |
Ipplepen and The Kerswells
Ipplepen and The Kerswells[34] | Party | Candidate | Votes | % |
| | Liberal Democrats | Alistair Dewhirst | 2,128 | 46.0 |
| | Conservative | Chris Clarance | 2,043 | 44.2 |
| | Green | Amy Caroline Walkden | 160 | 3.5 |
| | Labour | Adam Matthew Benedict Bell | 147 | 3.2 |
| | UKIP | Gerrie Williams | 137 | 3.0 |
| Majority | 85 | 1.8 |
| Turnout | 4,626 | 44.8 |
| | Liberal Democrats win (new seat) |
Ivybridge
Ivybridge[35] | Party | Candidate | Votes | % |
| | Conservative | Roger Frederick Croad | 1,751 | 55.7 |
| | Labour | Tony Rea | 852 | 27.1 |
| | Liberal Democrats | Laurel Lawford | 190 | 6.0 |
| | UKIP | Ian Ross | 186 | 5.9 |
| | Green | Phil Picton | 163 | 5.2 |
| Majority | 899 | 28.6 |
| Turnout | 3,145 | 35.2 |
| | Conservative hold |
Kingsbridge
Kingsbridge[36] | Party | Candidate | Votes | % |
| | Liberal Democrats | Julian Brazil | 2,265 | 51.2 |
| | Conservative | Josh Gardner | 1,845 | 41.7 |
| | Labour | Gerrie Lee Messer | 306 | 6.9 |
| Majority | 420 | 9.5 |
| Turnout | 4,427 | 42.2 |
| | Liberal Democrats win (new seat) |
Kingsteignton and Teign Estuary
Kingsteignton and Teign Estuary[37] | Party | Candidate | Votes | % |
| | Conservative | Ron Peart | 1,911 | 52.3 |
| | Liberal Democrats | Dave Rollason | 900 | 24.6 |
| | Independent | Tony Dempster | 359 | 9.8 |
| | Labour | James William Osben | 317 | 8.7 |
| | Green | Jennie Osborne | 158 | 4.3 |
| Majority | 1,011 | 27.7 |
| Turnout | 3,656 | 32.6 |
| | Conservative win (new seat) |
Newton Abbot North
Newton Abbot North[38] | Party | Candidate | Votes | % |
| | Liberal Democrats | Jackie Brodie | 1,160 | 38.4 |
| | Conservative | Philip Andrew Bullivant | 1,023 | 33.9 |
| | Independent | Mike Hocking | 402 | 13.3 |
| | Labour | Carl Alderton | 254 | 8.4 |
| | UKIP | Steven James Harvey | 161 | 5.3 |
| Majority | 137 | 4.5 |
| Turnout | 3,017 | 30.1 |
| | Liberal Democrats gain from Conservative |
Newton Abbot South
Newton Abbot South[39] | Party | Candidate | Votes | % |
| | Liberal Democrats | Gordon Nicholas Hook | 2,091 | 61.5 |
| | Conservative | Dennis Esmond Smith | 938 | 27.6 |
| | Labour | Jackie Jackson | 272 | 8.0 |
| | Green | Mike Rickard | 91 | 2.7 |
| Majority | 1,153 | 33.9 |
| Turnout | 3,398 | 35.0 |
| | Liberal Democrats hold |
Northam
Northam[40] | Party | Candidate | Votes | % |
| | Conservative | Andrew John Eastman | 2,189 | 53.6 |
| | UKIP | Chris Leather | 719 | 17.6 |
| | Labour | Stan Coates | 468 | 11.5 |
| | Liberal Democrats | David Berryman | 356 | 8.7 |
| | Green | Peter Graham Hames | 343 | 8.4 |
| Majority | 1,470 | 36.0 |
| Turnout | 4,087 | 40.8 |
| | Conservative hold |
Okehampton Rural
Okehampton Rural[41] | Party | Candidate | Votes | % |
| | Conservative | Kevin Ball | 2,008 | 49.2 |
| | Independent | Tony Leech | 702 | 17.2 |
| | Labour | Caleb William Mark Stevens | 538 | 13.2 |
| | Liberal Democrats | John Farrand-Rogers | 383 | 9.4 |
| | Green | Sally Parkins | 248 | 6.1 |
| | UKIP | Alan Gross | 187 | 4.6 |
| Majority | 1,306 | 32.0 |
| Turnout | 4,078 | 35.6 |
| | Conservative hold |
Otter Valley
Otter Valley[42] | Party | Candidate | Votes | % |
| | Independent | Claire L Wright | 3,638 | 74.6 |
| | Conservative | Tim Venner | 1,104 | 22.6 |
| | Labour | George E Downs | 123 | 2.5 |
| Majority | 2,534 | 52.0 |
| Turnout | 4,875 | 46.1 |
| | Independent win (new seat) |
Pinhoe and Mincinglake
Pinhoe and Mincinglake[43] | Party | Candidate | Votes | % |
| | Labour | Hilary Ackland | 1,718 | 46.2 |
| | Conservative | Lee Mottram | 1,427 | 38.4 |
| | Liberal Democrats | Michael Geoffrey Payne | 208 | 5.6 |
| | UKIP | Robert Julian Ball | 190 | 5.1 |
| | Green | Bethany Amber Payne | 160 | 4.3 |
| Majority | 291 | 7.8 |
| Turnout | 3,716 | 39.2 |
| | Labour hold |
Salcombe
Salcombe[44] | Party | Candidate | Votes | % |
| | Conservative | Rufus Gilbert | 2,236 | 61.5 |
| | Liberal Democrats | Elizabeth Dawn Huntley | 895 | 24.6 |
| | Labour | David Trigger | 271 | 7.5 |
| | Green | John Green | 231 | 6.4 |
| Majority | 1,341 | 36.9 |
| Turnout | 3,635 | 40.5 |
| | Conservative win (new seat) |
Seaton and Colyton
Seaton and Colyton[45] | Party | Candidate | Votes | % |
| | East Devon Alliance | Martin Shaw | 1,826 | 38.0 |
| | Conservative | Helen E Parr | 1,784 | 37.1 |
| | Liberal Democrats | Peter W Burrows | 524 | 10.9 |
| | Independent | Jim Knight | 441 | 9.2 |
| | Labour | Ian J Martin | 222 | 4.6 |
| Majority | 42 | 0.9 |
| Turnout | 4,810 | 41.0 |
| | East Devon Alliance win (new seat) |
Sidmouth
Sidmouth[46] | Party | Candidate | Votes | % |
| | Conservative | Stuart Hughes | 2,390 | 47.3 |
| | East Devon Alliance | Marianne P Rixson | 1,909 | 37.7 |
| | Liberal Democrats | Peter W Burrows | 524 | 10.9 |
| | Independent | Jim Knight | 441 | 9.2 |
| | Labour | Ian J Martin | 222 | 4.6 |
| Majority | 481 | 9.6 |
| Turnout | 4,810 | 41.0 |
| | Conservative win (new seat) |
South Brent and Yealmpton
South Brent and Yealmpton[47] | Party | Candidate | Votes | % |
| | Conservative | Richard Hosking | 2,226 | 51.9 |
| | Liberal Democrats | Antony David Power | 1,312 | 30.6 |
| | Green | Marianne Tissandier | 403 | 9.4 |
| | Labour | Lisette Mai Granados | 340 | 7.9 |
| Majority | 914 | 21.3 |
| Turnout | 4,290 | 42.0 |
| | Conservative win (new seat) |
South Molton
South Molton[48] | Party | Candidate | Votes | % |
| | Conservative | Jeremy Owen Yabsley | 2,217 | 57.9 |
| | Liberal Democrats | Matt Bushell | 1,152 | 30.1 |
| | Labour | Steven William Hinchliffe | 277 | 7.2 |
| | Green | Ian Derek Henry Horsnell | 172 | 4.5 |
| Majority | 1,065 | 27.8 |
| Turnout | 3,827 | 39.1 |
| | Conservative hold |
St. Davids and Haven Banks
St. Davids and Haven Banks[49] | Party | Candidate | Votes | % |
| | Labour | Marilyn Carol Whitton | 1,556 | 44.1 |
| | Conservative | Aric Samuel David Glinsky | 906 | 25.7 |
| | Green | Diana Frances Moore | 620 | 17.6 |
| | Liberal Democrats | Kevin Martin Chun | 342 | 9.7 |
| | UKIP | Brian Jeffery | 95 | 2.7 |
| Majority | 650 | 18.4 |
| Turnout | 3,531 | 36.8 |
| | Labour win (new seat) |
St. Sidwells and St. James
St. Sidwells and St. James[50] | Party | Candidate | Votes | % |
| | Labour | Su Aves | 2,135 | 60.7 |
| | Conservative | Anne Margaret Jobson | 734 | 20.9 |
| | Green | Tom Milburn | 353 | 10.0 |
| | Liberal Democrats | Alexandra Vanessa Newcombe | 285 | 8.1 |
| Majority | 1,401 | 39.8 |
| Turnout | 3,519 | 36.6 |
| | Labour win (new seat) |
Tavistock
Tavistock[51] | Party | Candidate | Votes | % |
| | Conservative | Debo Sellis | 1,922 | 49.2 |
| | Independent | Jeff Moody | 1,098 | 28.1 |
| | Liberal Democrats | Chris Bones | 297 | 7.6 |
| | Labour | Roy Kendrick | 249 | 6.4 |
| | Green | Colin Bannon | 229 | 5.9 |
| | UKIP | Duncan Stuart Elliott Parker | 110 | 2.8 |
| Majority | 824 | 21.1 |
| Turnout | 3,910 | 38.5 |
| | Conservative hold |
Teignmouth
Teignmouth[52] | Party | Candidate | Votes | % |
| | Conservative | Sylvia Russell | 1,736 | 40.0 |
| | Liberal Democrats | Richard Younger-Ross | 1,714 | 39.5 |
| | Labour | Lillian Chasteau | 437 | 10.1 |
| | UKIP | Jackie Hooper | 249 | 5.7 |
| | Green | Benjamin Stevens | 193 | 4.5 |
| Majority | 22 | 0.5 |
| Turnout | 4,335 | 37.3 |
| | Conservative gain from Liberal Democrats |
Tiverton East
Tiverton East[53] | Party | Candidate | Votes | % |
| | Conservative | Colin Slade | 1,253 | 41.5 |
| | Liberal Democrats | Kevin Wilson | 912 | 30.2 |
| | Labour | Steve Bush | 550 | 18.2 |
| | UKIP | Jonathan Smith | 294 | 9.7 |
| Majority | 341 | 11.3 |
| Turnout | 3,018 | 31.5 |
| | Conservative gain from Liberal Democrats |
Tiverton West
Tiverton West[54] | Party | Candidate | Votes | % |
| | Conservative | Polly Colthorpe | 1,624 | 43.6 |
| | UKIP | Ron Dolley | 691 | 18.6 |
| | Labour | Tim Bridger | 617 | 16.6 |
| | Liberal Democrats | Ben Holdman | 392 | 10.5 |
| | Liberal | Jenny Roach | 383 | 10.3 |
| Majority | 933 | 25.1 |
| Turnout | 3,721 | 35.2 |
| | Conservative hold |
Torrington Rural
Torrington Rural[55] | Party | Candidate | Votes | % |
| | Conservative | Andrew Saywell | 1,858 | 40.4 |
| | Liberal Democrats | Ray Auvray | 855 | 18.6 |
| | Labour Co-op | James Andrew Craigie | 678 | 14.7 |
| | UKIP | Roger Darch | 576 | 12.5 |
| | No description | Andy Boyd | 369 | 8.0 |
| | Green | Keith Stuart Funnell | 260 | 5.6 |
| Majority | 1,003 | 21.8 |
| Turnout | 4,603 | 41.2 |
| | Conservative hold |
Totnes and Dartington
Totnes and Dartington[56] | Party | Candidate | Votes | % |
| | Green | Jacqi Hodgson | 1,524 | 34.9 |
| | Liberal Democrats | Robert Vint | 1,304 | 29.9 |
| | Conservative | Rose Rowe | 892 | 20.4 |
| | Labour | Evelyn Ruth Burges | 546 | 12.5 |
| | UKIP | Alan Langmaid | 96 | 2.2 |
| Majority | 220 | 5.0 |
| Turnout | 4,368 | 44.3 |
| | Green win (new seat) |
Wearside and Topsham
Wearside and Topsham[57] | Party | Candidate | Votes | % |
| | Conservative | Andrew Robert Leadbetter | 2,226 | 54.8 |
| | Labour | Eliot Paul Wright | 1,335 | 32.8 |
| | Liberal Democrats | Mick Craig | 272 | 6.7 |
| | Green | Mark Shorto | 227 | 5.6 |
| Majority | 891 | 21.9 |
| Turnout | 4,065 | 43.3 |
| | Conservative win (new seat) |
Whimple and Blackdown
Whimple and Blackdown[58] | Party | Candidate | Votes | % |
| | Conservative | Iain Chubb | 2,716 | 65.5 |
| | Liberal Democrats | Jules Hoyles | 973 | 23.5 |
| | Labour | Steve Greenway | 426 | 10.3 |
| Majority | 1,743 | 42.0 |
| Turnout | 4,146 | 38.4 |
| | Conservative win (new seat) |
Willand and Uffculme
Willand and Uffculme[59] | Party | Candidate | Votes | % |
| | Conservative | Ray Radford | 1,932 | 52.5 |
| | Liberal Democrats | Simon John Clist | 805 | 21.9 |
| | Independent | Margaret Dennis | 414 | 11.3 |
| | Labour | Fiona Hutton | 298 | 8.1 |
| | Green | Jo Norton | 224 | 6.1 |
| Majority | 1,127 | 30.6 |
| Turnout | 3,678 | 35.0 |
| | Conservative hold |
Wonford and St. Loyes
Wonford and St. Loyes[60] | Party | Candidate | Votes | % |
| | Labour | Marina Asvachin | 1,494 | 47.1 |
| | Conservative | Rob Newby | 1,186 | 37.4 |
| | Liberal Democrats | Thomas Jacob Deakin | 216 | 6.8 |
| | Green | Lynn Susan Wetenhall | 135 | 4.3 |
| | UKIP | Alison Jane Sheridan | 132 | 4.2 |
| Majority | 308 | 9.7 |
| Turnout | 3,170 | 33.7 |
| | Labour win (new seat) |
Yelverton Rural
Yelverton Rural[61] | Party | Candidate | Votes | % |
| | Conservative | Philip Richard Sanders | 2,151 | 45.0 |
| | Independent | Ric Cheadle | 989 | 20.7 |
| | Green | Lucy Wood | 511 | 10.7 |
| | Liberal Democrats | Gail Bones | 438 | 9.2 |
| | UKIP | David Pengelly | 344 | 7.2 |
| | Labour | Ruth Mary Craigie | 332 | 6.9 |
| Majority | 1,162 | 24.3 |
| Turnout | 4,778 | 41.7 |
| | Conservative hold |
Notes
References


 Council elections in Devon


