2017 UK local government election
2017 Wiltshire Council election
|
| ← 2013 | 4 May 2017 (2017-05-04) | 2021 → |
|
All 98 seats to Wiltshire Council
50 seats needed for a majority |
|---|
| |
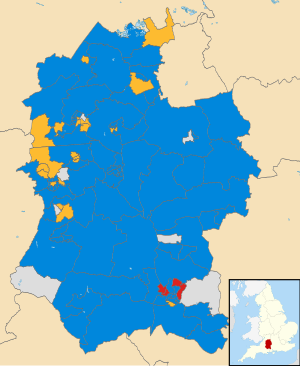 Map showing the composition of Wiltshire Council following the election. Blue showing Conservative, Red showing Labour, Yellow showing Liberal Democrats and Grey showing Independents. |
Council control before election
Conservative
| Council control after election
Conservative
| |
The 2017 Wiltshire Council election took place on 4 May 2017 as part of the 2017 local elections in the United Kingdom.[1] All 98 councillors were elected from electoral divisions which returned one councillor each by first-past-the-post voting for a four-year term of office.
Composition before election
| Elected in 2013 | Before election |
| Party | Seats | Party | Seats |
| | Conservative | 58 | | Conservative | 62 |
| | Liberal Democrats | 27 | | Liberal Democrats | 22 |
| | Independent | 8 | | Independent | 10 |
| | Labour | 4 | | Labour | 4 |
| | UKIP | 1 | | UKIP | 1 |
Uncontested election
At the close of nominations on 4 April 2017, there was one electoral division in which only one candidate had come forward: John Smale (Conservative), in Bulford, Allington and Figheldean. He was thus elected unopposed.[2]
Results summary
Wiltshire Council election, 2017[3] | Party | Seats | Gains | Losses | Net gain/loss | Seats % | Votes % | Votes | +/− |
| | Conservative | 68 | 13 | 3 | +10 | 69.4 | 51.9 | 65,584 | 17,003 |
| | Liberal Democrats | 20 | 3 | 10 | -7 | 20.4 | 26.0 | 32,812 | 9812 |
| | Labour | 3 | 0 | 1 | -1 | 3.1 | 9.1 | 11,839 | 314 |
| | Independent | 7 | 2 | 3 | -1 | 7.4 | 9.1 | 11,551 | -43 |
| | Green | 0 | 0 | 0 | 0 | 0 | 2.1 | 3,003 | 2323 |
| | Devizes Guardians | 0 | 0 | 0 | 0 | 0 | 0.7 | 905 | -494 |
| | UKIP | 0 | 0 | 1 | –1 | 0 | 0.5 | 685 | -15,956 |
| | Together We Can Reform | 0 | 0 | 0 | 0 | 0 | 0.0 | 21 | 21 |
Electoral division results
The electoral division results listed below are based on the changes from the 2013 elections, not taking into account any party defections or by-elections.
Aldbourne and Ramsbury
Aldbourne and Ramsbury | Party | Candidate | Votes | % | ±% |
| | Conservative | James Sheppard | 1,056 | 67.4 | +3.5 |
| | Liberal Democrats | Fran Bishop | 538 | 17.8 | n/a |
| | Labour | Jason Steven Haythornwaite | 147 | 9.4 | n/a |
| | Green | Brian Roy Utton | 147 | 5.4 | n/a |
| Majority | 778 | 49.6 | |
| Turnout | 1,568 | 38.8 | +1.5 |
| | Conservative hold | Swing | | |
Alderbury and Whiteparish
Alderbury and Whiteparish | Party | Candidate | Votes | % | ±% |
| | Conservative | Richard Britton | 825 | 59.4 | +2.8 |
| | Independent | Gideon Bruce Aymes | 342 | 24.6 | n/a |
| | Liberal Democrats | John Phillip Edrich | 118 | 8.5 | n/a |
| | Labour | Kim Eleanor Glennon-Alty | 105 | 7.6 | −3.7 |
| Majority | 483 | 34.8 | |
| Turnout | 1,394 | 41.0 | +5.0 |
| | Conservative hold | Swing | | |
Amesbury East
Amesbury East | Party | Candidate | Votes | % | ±% |
| | Conservative | Robert Alexander Yuill | 669 | 48.2 | +3.5 |
| | Liberal Democrats | Helen Martina Holdsworth | 434 | 31.3 | n/a |
| | UKIP | Rhod Evans | 118 | 8.5 | −33.8 |
| | Labour | Julie Anne Martingale | 84 | 6.1 | −6.9 |
| Majority | 235 | 16.9 | |
| Turnout | 1,389 | 29.7 | |
| | Conservative hold | Swing | | |
Note: Jamie Paul Capp had previously gained the seat for the Liberal Democrats in a 2016 by-election.
Amesbury West
Amesbury West | Party | Candidate | Votes | % | ±% |
| | Conservative | Fred Westmoreland | 874 | 74.2 | +37.2 |
| | Labour | Tom Corbin | 168 | 14.3 | +3.0 |
| | Liberal Democrats | Gerard Francis Wynn | 136 | 11.5 | n/a |
| Majority | 706 | 58.9 | |
| Turnout | 1,196 | 32.3 | +0.2 |
| | Conservative hold | Swing | | |
Bourne and Woodford Valley
Bourne and Woodford Valley | Party | Candidate | Votes | % | ±% |
| | Conservative | Mike Hewitt | 983 | 65.5 | −6.4 |
| | Liberal Democrats | Dineen Marianne Hopper | 364 | 24.2 | n/a |
| | Labour | Lindsey Elizabeth Bellringer | 155 | 10.3 | −17.8 |
| Majority | 619 | 41.3 | |
| Turnout | 1,509 | 43.7 | +8.7 |
| | Conservative hold | Swing | | |
Box and Colerne
Box and Colerne | Party | Candidate | Votes | % | ±% |
| | Liberal Democrats | Brian George Felton Mathew | 979 | 52.4 | +15.2 |
| | Conservative | Sheila Gladys Parker | 818 | 43.8 | +0.8 |
| | Labour | Peter Neil Baldrey | 70 | 3.8 | −5.2 |
| Majority | 161 | 8.6 | |
| Turnout | 1,867 | 49.2 | +8.1 |
| | Liberal Democrats gain from Conservative | Swing | | |
Bradford-on-Avon North
Bradford-on-Avon North | Party | Candidate | Votes | % | ±% |
| | Liberal Democrats | Jim Lynch | 1,262 | 59.8 | +13.1 |
| | Conservative | Pam Hyde | 850 | 40.3 | +20.1 |
| Majority | 412 | 19.5 | |
| Turnout | 2,145 | 56.5 | +14.9 |
| | Liberal Democrats hold | Swing | | |
Bradford-on-Avon South
Bradford-on-Avon South | Party | Candidate | Votes | % | ±% |
| | Liberal Democrats | Sarah Gibson | 1,197 | 55.8 | +7.3 |
| | Conservative | Clive Alfred Samuel Hilton | 724 | 33.8 | +11.4 |
| | Labour | Rosie Macgregor | 224 | 10.4 | −3.4 |
| Majority | 473 | 22.0 | |
| Turnout | 2,157 | 52.8 | +8.9 |
| | Liberal Democrats hold | Swing | | |
Brinkworth
Brinkworth | Party | Candidate | Votes | % | ±% |
| | Conservative | Toby Russell Sturgis | 1,083 | 65.4 | +6.2 |
| | Liberal Democrats | Christopher Hugh Tuite | 572 | 34.6 | +20.3 |
| Majority | 511 | 30.8 | |
| Turnout | 1,667 | 45.2 | +7.3 |
| | Conservative hold | Swing | | |
Bromham, Rowde and Potterne
Bromham, Rowde and Potterne | Party | Candidate | Votes | % | ±% |
| | Conservative | Anna Louise Cuthbert | 823 | 59.3 | +3.8 |
| | Independent | Philip Alfred Brown | 242 | 17.4 | n/a |
| | Liberal Democrats | Ralph Andre Frederick Elia | 138 | 9.9 | n/a |
| | Labour | Dianne Mary Gilpin | 106 | 7.6 | n/a |
| | Green | Margaret Ursula Green | 79 | 5.7 | n/a |
| Majority | 581 | 41.9 | |
| Turnout | 1,394 | 36.1 | −38.4 |
| | Conservative hold | Swing | | |
Note: Anna Louise Cuthbert had previously held the seat for the Conservative Party in a 2015 by-election.
Bulford, Allington and Figheldean
Bulford, Allington and Figheldean | Party | Candidate | Votes | % | ±% |
| | Conservative | John Frederick Smale | unopposed | n/a | n/a |
| | Conservative hold |
Burbage and The Bedwyns
Burbage and The Bedwyns | Party | Candidate | Votes | % | ±% |
| | Conservative | Stuart John Kennedy Wheeler | 1,021 | 68.0 | −14.6 |
| | Liberal Democrats | Parvis Jamieson | 216 | 14.4 | n/a |
| | Labour | John Brian Thornton | 134 | 8.9 | −8.5 |
| | Green | Emma Jane Clarissa Dawnay | 130 | 8.7 | n/a |
| Majority | 805 | 53.6 | |
| Turnout | 1,504 | 38.8 | +7.2 |
| | Conservative hold | Swing | | |
By Brook
By Brook | Party | Candidate | Votes | % | ±% |
| | Conservative | Jane Scott | 1,032 | 71.5 | +5.5 |
| | Liberal Democrats | Mary Geraldine Sheila Finch | 223 | 15.5 | +2.8 |
| | Green | Phillip Christopher Chamberlain | 100 | 6.9 | n/a |
| | Labour | Stephen Charles Wheeler | 88 | 6.1 | n/a |
| Majority | 809 | 56.0 | |
| Turnout | 1,446 | 40.3 | +4.7 |
| | Conservative hold | Swing | | |
Note: Jane Scott retired in February 2020.[4]
Calne Central
Calne Central | Party | Candidate | Votes | % | ±% |
| | Liberal Democrats | Ian Leslie Thorn | 754 | 51.6 | +13.5 |
| | Conservative | Howard Robin Marshall | 562 | 38.5 | +2.1 |
| | Labour | John Boaler | 144 | 9.9 | n/a |
| Majority | 192 | 13.1 | |
| Turnout | 1,462 | 42.6 | +9.5 |
| | Liberal Democrats hold | Swing | | |
Calne Chilvester and Abberd
Calne Chilvester and Abberd | Party | Candidate | Votes | % | ±% |
| | Conservative | Tony Trotman | 683 | 50.4 | +3.9 |
| | Liberal Democrats | Robert Matthew Merrick | 417 | 30.8 | +6.2 |
| | Labour | Mike MacGregor-Fairlie | 254 | 18.8 | n/a |
| Majority | 266 | 19.6 | |
| Turnout | 1,356 | 34.4 | +7.6 |
| | Conservative hold | Swing | | |
Calne North
Calne North | Party | Candidate | Votes | % | ±% |
| | Conservative | Tom Rounds | 459 | 45.4 | +11.1 |
| | Liberal Democrats | Glenis Jean Ansell | 380 | 37.6 | −2.4 |
| | Labour | Jon Fisher | 172 | 17.0 | n/a |
| Majority | 79 | 7.8 | |
| Turnout | 1,014 | 30.8 | +6.4 |
| | Conservative gain from Liberal Democrats | Swing | | |
Calne Rural
Calne Rural | Party | Candidate | Votes | % | ±% |
| | Conservative | Christine Crisp | 1,092 | 68.2 | +21.0 |
| | Liberal Democrats | Rob Clarke | 356 | 22.2 | +13.2 |
| | Labour | Tom Morris | 154 | 9.6 | n/a |
| Majority | 736 | 45.8 | |
| Turnout | 1,607 | 45.5 | +4.7 |
| | Conservative hold | Swing | | |
Calne South and Cherhill
Calne South and Cherhill | Party | Candidate | Votes | % | ±% |
| | Conservative | Alan Kenneth Hill | 892 | 65.1 | +18.5 |
| | Liberal Democrats | Declan Alexander William Boore | 312 | 22.8 | −5.4 |
| | Labour | John Alan Bennett | 167 | 12.2 | n/a |
| Majority | 580 | 45.8 | |
| Turnout | 1,380 | 36.6 | +0.4 |
| | Conservative hold | Swing | | |
Chippenham Cepen Park and Derriads
Chippenham Cepen Park and Derriads | Party | Candidate | Votes | % | ±% |
| | Conservative | Peter John Hutton | 901 | 68.0 | +22.3 |
| | Liberal Democrats | Christopher Leonard Norris | 270 | 20.4 | +11.1 |
| | Labour | Ian Shaun Flower | 155 | 11.7 | −3.2 |
| Majority | 631 | 47.3 | |
| Turnout | 1,333 | 39.7 | +6.3 |
| | Conservative hold | Swing | | |
Chippenham Cepen Park and Redlands
Chippenham Cepen Park and Redlands | Party | Candidate | Votes | % | ±% |
| | Conservative | Andy Phillips | 700 | 63.4 | +13.4 |
| | Liberal Democrats | Conor Melvin | 268 | 24.3 | +14.4 |
| | Labour | Jeremy Richard Griffin Comerford | 137 | 12.4 | −4.8 |
| Majority | 432 | 39.1 | |
| Turnout | 1,106 | 31.4 | +2.3 |
| | Conservative hold | Swing | | |
Chippenham Hardenhuish
Chippenham Hardenhuish | Party | Candidate | Votes | % | ±% |
| | Conservative | Melody Rhonda Thompson | 669 | 46.7 | +27.5 |
| | Liberal Democrats | Daniel Andrew Webb | 634 | 44.3 | +14.3 |
| | Labour | David Charles Barter | 128 | 8.9 | +2.2 |
| Majority | 35 | 2.4 | |
| Turnout | 1,440 | 41.5 | +4.4 |
| | Conservative gain from Liberal Democrats | Swing | | |
Note: Melody Rhonda Thompson had previously gained the seat for the Conservative Party in a 2015 by-election.
Chippenham Hardens and England
Chippenham Hardens and England | Party | Candidate | Votes | % | ±% |
| | Liberal Democrats | Bill Douglas | 662 | 54.9 | +17.3 |
| | Conservative | Robert John Bradfield Giles | 543 | 45.1 | +22.5 |
| Majority | 119 | 9.7 | |
| Turnout | 1,223 | 37.1 | +6.2 |
| | Liberal Democrats hold | Swing | | |
Chippenham Lowden and Rowden
Chippenham Lowden and Rowden | Party | Candidate | Votes | % | ±% |
| | Liberal Democrats | Ross Henning | 539 | 40.1 | +7.9 |
| | Independent | David Keith Poole | 406 | 30.2 | n/a |
| | Conservative | Paul Duncan Newman | 400 | 29.7 | +9.5 |
| Majority | 133 | 9.8 | |
| Turnout | 1,353 | 37.0 | +6.7 |
| | Liberal Democrats hold | Swing | | |
Chippenham Monkton
Chippenham Monkton | Party | Candidate | Votes | % | ±% |
| | Independent | Nick Murry | 983 | 62.4 | n/a |
| | Conservative | Caroline Veronica Ramsey | 300 | 19.0 | +6.7 |
| | Liberal Democrats | Matt Harding | 293 | 18.6 | −51.7 |
| Majority | 683 | 43.1 | |
| Turnout | 1,585 | 52.2 | +5.8 |
| | Independent gain from Liberal Democrats | Swing | | |
Chippenham Pewsham
Chippenham Pewsham | Party | Candidate | Votes | % | ±% |
| | Liberal Democrats | Clare Morforwyn Cape | 740 | 51.5 | +3.6 |
| | Conservative | Teresa Marie Hutton | 696 | 48.5 | +23.9 |
| Majority | 44 | 3.0 | |
| Turnout | 1,448 | 42.0 | +10.6 |
| | Liberal Democrats hold | Swing | | |
Chippenham Queens and Sheldon
Chippenham Queens and Sheldon | Party | Candidate | Votes | % | ±% |
| | Conservative | Ashley O'Neill | 817 | 60.4 | +27.9 |
| | Liberal Democrats | Desna Barbara Allen | 536 | 39.6 | +4.4 |
| Majority | 281 | 20.7 | |
| Turnout | 1,357 | 41.3 | +4.0 |
| | Conservative gain from Liberal Democrats | Swing | | |
Corsham Pickwick
Corsham Pickwick | Party | Candidate | Votes | % | ±% |
| | Liberal Democrats | Ruth Mary Catherine Hopkinson | 753 | 50.3 | +36.7 |
| | Conservative | Alan MacRae | 601 | 40.2 | +4.4 |
| | Labour | William Stephen Gilbert | 142 | 9.5 | −12.4 |
| Majority | 152 | 10.1 | |
| Turnout | 1,500 | 39.8 | +8.8 |
| | Liberal Democrats gain from Conservative | Swing | | |
Corsham Town
Corsham Town | Party | Candidate | Votes | % | ±% |
| | Conservative | Philip Hardman Whalley | 980 | 52.5 | +12.8 |
| | Liberal Democrats | Kelly Ann Duckhouse | 746 | 40.0 | +6.5 |
| | Labour | Steve Abbott | 141 | 7.6 | +0.3 |
| Majority | 234 | 12.5 | |
| Turnout | 1,868 | 49.0 | +5.7 |
| | Conservative hold | Swing | | |
Corsham Without and Box Hill
Corsham Without and Box Hill | Party | Candidate | Votes | % | ±% |
| | Conservative | Ben Anderson | 1,168 | 69.4 | +12.8 |
| | Green | Tina Maria Johnston | 514 | 30.6 | n/a |
| Majority | 654 | 38.6 | |
| Turnout | 1,693 | 41.3 | +3.0 |
| | Conservative hold | Swing | | |
Cricklade and Latton
Cricklade and Latton | Party | Candidate | Votes | % | ±% |
| | Liberal Democrats | Bob Jones | 923 | 48.8 | −7.8 |
| | Conservative | Peter Anthony Colmer | 883 | 46.7 | +3.3 |
| | Labour | Graham William Davies | 85 | 4.5 | n/a |
| Majority | 40 | 2.1 | |
| Turnout | 1,894 | 48.7 | +7.1 |
| | Liberal Democrats hold | Swing | | |
Devizes and Roundway South
Devizes and Roundway South | Party | Candidate | Votes | % | ±% |
| | Conservative | Simon David Jacobs | 613 | 40.2 | +6.0 |
| | Devizes Guardians | Chris Greenwood | 294 | 19.3 | −10.7 |
| | Independent | Chris Callow | 177 | 11.6 | n/a |
| | Independent | Ian Richard Porter Hopkins | 168 | 11.0 | −5.6 |
| | Labour | Ivor Llewellyn Blackmore | 146 | 9.6 | −3.6 |
| | Liberal Democrats | James Thomas Melville Kay | 128 | 8.4 | +2.4 |
| Majority | 319 | 20.8 | |
| Turnout | 1,532 | 44.4 | +3.7 |
| | Conservative hold | Swing | | |
Devizes East
Devizes East | Party | Candidate | Votes | % | ±% |
| | Conservative | Peter Evans | 483 | 42.8 | −2.0 |
| | Devizes Guardians | Jane Mary Burton | 276 | 24.5 | −7.8 |
| | Liberal Democrats | Alan Charles Rankin | 192 | 17.0 | n/a |
| | Labour | Laura Kate Naylor | 177 | 15.7 | −7.2 |
| Majority | 207 | 18.2 | |
| Turnout | 1,135 | 36.7 | +5.5 |
| | Conservative hold | Swing | | |
Devizes North
Devizes North | Party | Candidate | Votes | % | ±% |
| | Conservative | Sue Evans | 579 | 46.8 | +4.9 |
| | Devizes Guardians | Nigel Denys Carter | 335 | 27.1 | −9.4 |
| | Green | Simon Charles Thompson | 171 | 13.8 | n/a |
| | Labour | Patricia Baxter | 153 | 12.4 | −9.2 |
| Majority | 244 | 19.6 | |
| Turnout | 1,245 | 38.7 | +5.5 |
| | Conservative hold | Swing | | |
Downton and Ebble Valley
Downton and Ebble Valley | Party | Candidate | Votes | % | ±% |
| | Conservative | Richard John Clewer | 944 | 64.7 | +2.6 |
| | Green | Robert William Steel | 208 | 14.3 | n/a |
| | Labour | Ben Wynn | 188 | 12.9 | n/a |
| | Liberal Democrats | Harry David Ashcroft | 120 | 8.2 | n/a |
| Majority | 736 | 50.3 | |
| Turnout | 1,464 | 39.0 | +0.6 |
| | Conservative hold | Swing | | |
Durrington and Larkhill
Durrington and Larkhill | Party | Candidate | Votes | % | ±% |
| | Independent | Graham Wright | 1,384 | 80.1 | +1.7 |
| | Conservative | Jan Burns | 345 | 20.0 | −1.6 |
| Majority | 1,039 | 59.8 | |
| Turnout | 1,738 | 34.9 | +5.3 |
| | Independent hold | Swing | | |
Note: Graham Wright had previously been elected in 2013 for the Liberal Democrats. The change in his voteshare shown is the change from the voteshare he won as a Liberal Democrat in 2013.
Ethandune
Ethandune | Party | Candidate | Votes | % | ±% |
| | Conservative | Jerry Wickham | 1,059 | 71.8 | +11.1 |
| | Liberal Democrats | Anne Elizabeth Ball | 416 | 28.2 | +3.6 |
| Majority | 643 | 43.1 | |
| Turnout | 1,492 | 41.3 | +5.6 |
| | Conservative hold | Swing | | |
Note: Jerry Wickham had previously held the seat for the Conservatives in a 2014 by-election.
Fovant and Chalke Valley
Fovant and Chalke Valley | Party | Candidate | Votes | % | ±% |
| | Conservative | Jose Green | 971 | 65.0 | n/a |
| | Independent | William Donald Keir Holmes | 339 | 22.7 | n/a |
| | Liberal Democrats | Oliver Arthur Broomfield Holdsworth | 185 | 12.4 | n/a |
| Majority | 632 | 42.1 | |
| Turnout | 1,501 | 44.1 | n/a |
| | Conservative hold | Swing | | |
Hilperton
Hilperton | Party | Candidate | Votes | % | ±% |
| | Independent | Ernie Clark | 1,342 | 79.7 | −7.7 |
| | Conservative | Charles Russ | 208 | 12.3 | +4.5 |
| | Liberal Democrats | George Stanton | 135 | 8.0 | n/a |
| Majority | 1,134 | 67.0 | |
| Turnout | 1,692 | 43.3 | +2.5 |
| | Independent hold | Swing | | |
Holt and Staverton
Holt and Staverton | Party | Candidate | Votes | % | ±% |
| | Liberal Democrats | Trevor William Carbin | 941 | 64.3 | +18.9 |
| | Conservative | Richard William Nathaniel Warren | 522 | 35.7 | +5.7 |
| Majority | 419 | 28.6 | |
| Turnout | 1,466 | 42.0 | +8.4 |
| | Liberal Democrats hold | Swing | | |
Kington
Kington | Party | Candidate | Votes | % | ±% |
| | Conservative | Howard Greenman | 1,257 | 69.2 | +6.0 |
| | Liberal Democrats | Matthew John Bragg | 380 | 20.9 | +4.5 |
| | Labour | Liam Nicholas John Stokes | 179 | 9.9 | n/a |
| Majority | 877 | 48.3 | |
| Turnout | 1,817 | 45.4 | +4.5 |
| | Conservative hold | Swing | | |
Laverstock, Ford and Old Sarum
Laverstock, Ford and Old Sarum | Party | Candidate | Votes | % | ±% |
| | Labour | Ian David McLennan | 1,050 | 63.4 | −11.1 |
| | Conservative | Mark Jonathan Lamdin McClelland | 607 | 36.6 | +11.1 |
| Majority | 443 | 26.7 | |
| Turnout | 1,660 | 41.7 | +9.3 |
| | Labour hold | Swing | | |
Ludgershall and Perham Down
Ludgershall and Perham Down | Party | Candidate | Votes | % | ±% |
| | Conservative | Chris Williams | 679 | 69.9 | n/a |
| | Liberal Democrats | Charles Edward Lambert | 100 | 10.3 | n/a |
| | UKIP | Leslie Alexander Webster | 98 | 10.1 | n/a |
| | Green | Teresa Mary Thornton | 94 | 9.7 | n/a |
| Majority | 579 | 69.6 | |
| Turnout | 976 | 26.7 | n/a |
| | Conservative hold | Swing | | |
Lyneham
Lyneham | Party | Candidate | Votes | % | ±% |
| | Conservative | Allison Mary Bucknell | 938 | 77.0 | +18.0 |
| | Liberal Democrats | Trudie Ann Clarkson | 217 | 17.8 | +5.0 |
| | Labour | Terry Couchman | 64 | 5.3 | n/a |
| Majority | 721 | 59.0 | |
| Turnout | 1,223 | 38.7 | +5.3 |
| | Conservative hold | Swing | | |
Malmesbury
Malmesbury | Party | Candidate | Votes | % | ±% |
| | Liberal Democrats | Gavin Grant | 946 | 53.9 | +5.7 |
| | Conservative | Frances Sheppard | 699 | 39.8 | +11.6 |
| | Labour | Fred Price | 110 | 6.3 | −1.7 |
| Majority | 247 | 14.0 | |
| Turnout | 1,761 | 43.1 | +3.3 |
| | Liberal Democrats hold | Swing | | |
Marlborough East
Marlborough East | Party | Candidate | Votes | % | ±% |
| | Conservative | Stewart Raymond Dobson | 733 | 60.5 | +28.4 |
| | Liberal Democrats | John Alexander Kirk Wilson | 274 | 22.6 | +10.9 |
| | Labour | Katherine Grace Davis | 205 | 16.9 | +8.6 |
| Majority | 459 | 37.7 | |
| Turnout | 1,217 | 37.1 | +3.6 |
| | Conservative hold | Swing | | |
Marlborough West
Marlborough West | Party | Candidate | Votes | % | ±% |
| | Independent | Nick Fogg | 754 | 54.6 | −0.9 |
| | Conservative | Tamara Louise Reay | 507 | 36.7 | −1.9 |
| | Labour | Sylvia Christine Card | 121 | 8.8 | +2.9 |
| Majority | 247 | 17.8 | |
| Turnout | 1,386 | 46.6 | +6.6 |
| | Independent hold | Swing | | |
Melksham Central
Melksham Central | Party | Candidate | Votes | % | ±% |
| | Liberal Democrats | Hayley Jayne Spencer | 481 | 37.9 | +8.2 |
| | Conservative | Mike Swanton | 379 | 29.8 | +6.2 |
| | UKIP | David Martin Pollitt | 152 | 12.0 | −21.5 |
| | Independent | Martin Willard Pain | 150 | 11.8 | n/a |
| | Labour | Paul Grainger | 108 | 8.5 | −4.7 |
| Majority | 102 | 7.9 | |
| Turnout | 1,284 | 33.7 | +4.0 |
| | Liberal Democrats gain from UKIP | Swing | | |
Melksham North
Melksham North | Party | Candidate | Votes | % | ±% |
| | Liberal Democrats | Pat Aves | 590 | 45.5 | +13.7 |
| | Conservative | Nick Holder | 519 | 40.0 | +11.0 |
| | Independent | Geoff Mitcham | 104 | 8.0 | n/a |
| | Independent | Richard George Wiltshire | 85 | 6.6 | n/a |
| Majority | 71 | 5.4 | |
| Turnout | 1,311 | 36.3 | +3.3 |
| | Liberal Democrats hold | Swing | | |
Melksham South
Melksham South | Party | Candidate | Votes | % | ±% |
| | Liberal Democrats | Jon Hubbard | 1,045 | 68.4 | +17.6 |
| | Conservative | Mike Sankey | 484 | 31.7 | +16.8 |
| Majority | 561 | 36.3 | |
| Turnout | 1,544 | 38.6 | +1.6 |
| | Liberal Democrats hold | Swing | | |
Melksham Without North
Melksham Without North | Party | Candidate | Votes | % | ±% |
| | Conservative | Phil Alford | 1,019 | 54.9 | +28.4 |
| | Independent | Terry Chivers | 838 | 45.1 | +4.2 |
| Majority | 181 | 9.7 | |
| Turnout | 1,871 | 43.3 | +0.9 |
| | Conservative gain from Independent | Swing | | |
Melksham Without South
Melksham Without South | Party | Candidate | Votes | % | ±% |
| | Conservative | Roy Sidney While | 709 | 55.3 | +14.4 |
| | Liberal Democrats | Ryan James Clarke | 232 | 18.1 | +5.9 |
| | UKIP | Paul Robert Carter | 178 | 13.9 | −24.5 |
| | Independent | Steve Petty | 163 | 12.7 | −n/a |
| Majority | 477 | 37.0 | |
| Turnout | 1,289 | 32.0 | +2.4 |
| | Conservative hold | Swing | | |
Mere
Mere | Party | Candidate | Votes | % | ±% |
| | Independent | George Edwin Jeans | 1,339 | 66.9 | −9.3 |
| | Conservative | Mike Liddicoat | 399 | 19.9 | +4.1 |
| | Labour | John Anthony Jordan | 264 | 13.2 | n/a |
| Majority | 940 | 46.8 | |
| Turnout | 2,010 | 57.9 | |
| | Independent hold | Swing | | |
Minety
Minety | Party | Candidate | Votes | % | ±% |
| | Conservative | Chuck Berry | 1,137 | 74.3 | +21.7 |
| | Liberal Democrats | Nicola Helen Middleton | 294 | 19.2 | +9.5 |
| | Labour | Hilary Ann Foord | 99 | 6.5 | −1.2 |
| Majority | 843 | 54.9 | |
| Turnout | 1,535 | 40.1 | −2.6 |
| | Conservative hold | Swing | | |
Nadder and East Knoyle
Nadder and East Knoyle | Party | Candidate | Votes | % | ±% |
| | Conservative | Bridget Anne Wayman | 964 | 66.9 | +4.4 |
| | Liberal Democrats | Jill Caudle | 478 | 33.2 | n/a |
| Majority | 486 | 33.6 | |
| Turnout | 1,447 | 41.5 | +2.4 |
| | Conservative hold | Swing | | |
Pewsey
Pewsey | Party | Candidate | Votes | % | ±% |
| | Conservative | Jeremy James Kunkler | 1,085 | 72.1 | −2.0 |
| | Liberal Democrats | David Roland Leighton | 249 | 16.6 | n/a |
| | Labour | Hannah Sarah White-Overton | 170 | 11.3 | −14.6 |
| Majority | 836 | 55.2 | |
| Turnout | 1,514 | 39.4 | +4.6 |
| | Conservative hold | Swing | | |
Pewsey Vale
Pewsey Vale | Party | Candidate | Votes | % | ±% |
| | Conservative | Paul Oatway | 1,064 | 77.3 | +12.9 |
| | Liberal Democrats | Fiona Clare Hornby | 176 | 12.8 | −9.5 |
| | Labour | Michael Anthony Bohan | 137 | 10.0 | −3.3 |
| Majority | 888 | 64.3 | |
| Turnout | 1,382 | 39.2 | +4.3 |
| | Conservative hold | Swing | | |
Purton
Purton | Party | Candidate | Votes | % | ±% |
| | Conservative | Jacqui Lay | 991 | 74.7 | +3.9 |
| | Liberal Democrats | Kate Ann Blye | 335 | 25.3 | n/a |
| Majority | 656 | 49.1 | |
| Turnout | 1,337 | 32.2 | +2.9 |
| | Conservative hold | Swing | | |
Redlynch and Landford
Redlynch and Landford | Party | Candidate | Votes | % | ±% |
| | Conservative | Leo Randall | 1,020 | 66.5 | +7.9 |
| | Liberal Democrats | Martin James Rosell | 316 | 20.6 | n/a |
| | Labour | Finbarr Sheehan | 198 | 12.9 | −2.5 |
| Majority | 704 | 45.9 | |
| Turnout | 1,535 | 41.0 | +6.9 |
| | Conservative hold | Swing | | |
Roundway
Roundway | Party | Candidate | Votes | % | ±% |
| | Conservative | Laura Evelyn Mayes | 838 | 69.0 | +5.1 |
| | Labour | Kathleen Margaret Shaw | 137 | 11.3 | +1.3 |
| | Green | Geoff Brewer | 124 | 10.2 | n/a |
| | Liberal Democrats | Alasdair Kirkpatrick | 115 | 9.5 | n/a |
| Majority | 701 | 57.7 | |
| Turnout | 1,215 | 34.9 | +2.9 |
| | Conservative hold | Swing | | |
Royal Wootton Bassett East
Royal Wootton Bassett East | Party | Candidate | Votes | % | ±% |
| | Conservative | Mollie Eileen May Groom | 1,048 | 69.8 | −4.0 |
| | Liberal Democrats | Simon Richard Hodkinson | 279 | 18.6 | −7.6 |
| | Labour | James Edward Sexton | 174 | 11.6 | n/a |
| Majority | 769 | 50.9 | |
| Turnout | 1,512 | 39.2 | +5.8 |
| | Conservative hold | Swing | | |
Royal Wootton Bassett North
Royal Wootton Bassett North | Party | Candidate | Votes | % | ±% |
| | Conservative | Mary Isabel Champion | 744 | 52.6 | +6.6 |
| | Liberal Democrats | Stephen Richard Walls | 510 | 36.1 | +7.0 |
| | Labour | Heather Denise Reilly | 160 | 11.3 | n/a |
| Majority | 234 | 16.5 | |
| Turnout | 1,418 | 39.5 | +10.3 |
| | Conservative hold | Swing | | |
Royal Wootton Bassett South
Royal Wootton Basset South | Party | Candidate | Votes | % | ±% |
| | Liberal Democrats | Chris Hurst | 1,061 | 49.2 | +9.5 |
| | Conservative | Paul Justin Heaphy | 863 | 40.0 | +3.1 |
| | Labour | Ron Bardwell | 132 | 6.1 | −0.1 |
| | Independent | Peter Joseph Doyle | 102 | 4.7 | n/a |
| Majority | 198 | 9.1 | |
| Turnout | 2,164 | 44.0 | +6.1 |
| | Liberal Democrats hold | Swing | | |
Salisbury Bemerton
Salisbury Bemerton | Party | Candidate | Votes | % | ±% |
| | Labour | Ricky Rogers | 568 | 46.3 | −11.0 |
| | Conservative | Gavin Paul Barrett | 408 | 33.2 | +14.6 |
| | UKIP | Dean Palethorpe | 92 | 7.5 | −16.6 |
| | Liberal Democrats | Robert William Steel | 87 | 7.1 | n/a |
| | Green | Julia Anne Richardson | 73 | 5.9 | n/a |
| Majority | 160 | 13.0 | |
| Turnout | 1,232 | 28.0 | +6.1 |
| | Labour hold | Swing | | |
Salisbury Fisherton and Bemerton Village
Salisbury Fisherton and Bemerton Village | Party | Candidate | Votes | % | ±% |
| | Labour | John Michael Perrings Walsh | 471 | 34.3 | −2.2 |
| | Conservative | Jeremy Robert Lloyd Nettle | 405 | 29.5 | −6.9 |
| | Liberal Democrats | Mark Philip Duly | 208 | 15.1 | −12.0 |
| | Independent | Chris Cochrane | 139 | 10.1 | n/a |
| | Green | Alison Craig | 102 | 7.4 | n/a |
| | UKIP | Paddy Singh | 49 | 3.6 | n/a |
| Majority | 67 | 4.9 | |
| Turnout | 1,379 | 39.9 | +7.9 |
| | Labour hold | Swing | | |
Salisbury Harnham
Salisbury Harnham | Party | Candidate | Votes | % | ±% |
| | Liberal Democrats | Brian Edward Dalton | 827 | 44.5 | −2.3 |
| | Conservative | Simon James Jackson | 756 | 40.7 | +8.9 |
| | Labour | Merrin Holroyd | 112 | 6.0 | −0.9 |
| | Green | Peter Jolyon Matthews | 97 | 5.2 | n/a |
| | UKIP | Naomi May King | 66 | 3.6 | −9.9 |
| Majority | 71 | 3.8 | |
| Turnout | 1,862 | 45.5 | +8.6 |
| | Liberal Democrats hold | Swing | | |
Salisbury St Edmund and Milford
Salisbury St Edmund and Milford | Party | Candidate | Votes | % | ±% |
| | Conservative | Atiqul Hoque | 654 | 40.5 | +17.5 |
| | Liberal Democrats | Bobbie Chettleburgh | 551 | 34.1 | −8.9 |
| | Labour | Clive Robert Vincent | 209 | 12.9 | −1.6 |
| | Green | Sue Wright | 182 | 11.3 | +3.8 |
| | Together We Can Reform | Colin Skelton | 21 | 1.3 | n/a |
| Majority | 103 | 6.4 | |
| Turnout | 1,619 | 44.4 | +10.8 |
| | Conservative gain from Liberal Democrats | Swing | | |
Note: Atiqul Hoque had previously gained the seat for the Conservative Party in a 2015 by-election.
Salisbury St Francis and Stratford
Salisbury St Francis and Stratford | Party | Candidate | Votes | % | ±% |
| | Conservative | Mary Jacquelin Douglas | 909 | 49.4 | −4.7 |
| | Liberal Democrats | Julian James Sargood Ellis | 596 | 32.4 | +18.4 |
| | Green | Richard Bolton | 187 | 10.2 | −1.7 |
| | Labour | Steven Ian Wadsworth | 147 | 8.0 | −12.1 |
| Majority | 313 | 17.0 | |
| Turnout | 1,845 | 45.0 | +11.0 |
| | Conservative hold | Swing | | |
Salisbury St Marks and Bishopdown
Salisbury St Marks and Bishopdown | Party | Candidate | Votes | % | ±% |
| | Conservative | Derek William Brown | 671 | 45.0 | −12.4 |
| | Independent | Hilary Anne Davidson | 416 | 27.9 | n/a |
| | Liberal Democrats | Rebecca Ann Heulwen Foster | 241 | 16.2 | +0.2 |
| | Labour | Tom Mettyear | 164 | 11.0 | −15.6 |
| Majority | 255 | 17.0 | |
| Turnout | 1,496 | 37.2 | +5.8 |
| | Conservative hold | Swing | | |
Salisbury St Martins and Cathedral
Salisbury St Martins and Cathedral | Party | Candidate | Votes | % | ±% |
| | Conservative | Sven Hocking | 817 | 41.0 | +9.8 |
| | Labour | Ian Robert Tomes | 699 | 35.1 | −6.1 |
| | Liberal Democrats | Greg Condliffe | 313 | 15.7 | +9.3 |
| | Green | Teresa Jane Mary Fallon | 115 | 5.8 | −0.2 |
| | UKIP | Frances Mary Patricia Howard | 50 | 2.5 | −12.7 |
| Majority | 118 | 5.9 | |
| Turnout | 2,007 | 48.0 | +9.1 |
| | Conservative gain from Labour | Swing | | |
Salisbury St Pauls
Salisbury St Pauls | Party | Candidate | Votes | % | ±% |
| | Conservative | Matthew Jonathan Anthony Dean | 650 | 44.7 | +11.7 |
| | Liberal Democrats | Paul William Leslie Sample | 324 | 22.3 | +15.1 |
| | Labour | Caroline Susan Corbin | 301 | 20.7 | −7.1 |
| | Green | Benji Goehl | 180 | 12.4 | −2.6 |
| Majority | 326 | 22.3 | |
| Turnout | 1,462 | 39.3 | +7.7 |
| | Conservative hold | Swing | | |
Sherston
Sherston | Party | Candidate | Votes | % | ±% |
| | Conservative | John Percy Simon Stuart Thomson | 1,150 | 68.6 | −6.0 |
| | Liberal Democrats | Martin Fausing Smith | 418 | 24.9 | +10.9 |
| | Labour | Steven James Clark | 108 | 6.4 | −5.0 |
| Majority | 732 | 43.5 | |
| Turnout | 1,683 | 42.0 | +6.4 |
| | Conservative hold | Swing | | |
Southwick
Southwick | Party | Candidate | Votes | % | ±% |
| | Conservative | Horace John Prickett | 1,142 | 81.5 | +38.6 |
| | Liberal Democrats | Kevin Ian Cottrell | 259 | 18.5 | +14.5 |
| Majority | 883 | 62.4 | |
| Turnout | 1,415 | 39.9 | +6.3 |
| | Conservative hold | Swing | | |
Summerham and Seend
Summerham and Seend | Party | Candidate | Votes | % | ±% |
| | Conservative | Jonathon Seed | 1,047 | 56.1 | −12.2 |
| | Liberal Democrats | Jo McManus | 821 | 44.0 | n/a |
| Majority | 226 | 12.1 | |
| Turnout | 1,873 | 53.7 | +10.6 |
| | Conservative hold | Swing | | |
The Collingbournes and Netheravon
The Collingbournes and Netheravon | Party | Candidate | Votes | % | ±% |
| | Conservative | Ian Charles Duke Blair-Pilling | 808 | 63.8 | n/a |
| | Independent | Alan Stephen Wood | 276 | 21.8 | n/a |
| | Liberal Democrats | Glenn Barry Price | 91 | 7.2 | n/a |
| | Green | Denis Christopher Griffin | 91 | 7.2 | n/a |
| Majority | 532 | 42.0 | |
| Turnout | 1,266 | 38.6 | n/a |
| | Conservative hold | Swing | | |
The Lavingtons and Erlestoke
The Lavingtons and Erlestoke | Party | Candidate | Votes | % | ±% |
| | Conservative | Richard Elliott Gamble | 1,213 | 74.1 | −2.5 |
| | Liberal Democrats | Mark Domnech William Mangham | 157 | 9.6 | n/a |
| | Labour | Carol Black | 142 | 8.7 | −14.7 |
| | Green | Chris Gingell | 125 | 7.6 | n/a |
| Majority | 1,056 | 64.2 | |
| Turnout | 1,644 | 40.7 | +8.2 |
| | Conservative hold | Swing | | |
Tidworth
Tidworth | Party | Candidate | Votes | % | ±% |
| | Conservative | Mark Connolly | 711 | 84.3 | n/a |
| | Labour | Joan Barnett | 133 | 15.8 | n/a |
| Majority | 578 | 68.4 | |
| Turnout | 845 | 18.1 | n/a |
| | Conservative hold | Swing | | |
Till and Wylye Valley
Till and Wylye Valley | Party | Candidate | Votes | % | ±% |
| | Conservative | Darren George Henry | 1,134 | 54.2 | +14.5 |
| | Liberal Democrats | Ian Clive West | 923 | 44.1 | −11.0 |
| | Labour | Gary James Buckley | 34 | 1.6 | −3.6 |
| Majority | 211 | 10.1 | |
| Turnout | 2,095 | 57.8 | +12.5 |
| | Conservative gain from Liberal Democrats | Swing | | |
Tisbury
Tisbury | Party | Candidate | Votes | % | ±% |
| | Conservative | Tony Deane | 846 | 61.8 | +1.3 |
| | Liberal Democrats | Marcus Deyes | 341 | 24.9 | n/a |
| | Green | Christopher H Walford | 182 | 13.3 | n/a |
| Majority | 505 | 36.9 | |
| Turnout | 1,370 | 38.4 | +1.4 |
| | Conservative hold | Swing | | |
Trowbridge Adcroft
Trowbridge Adcroft | Party | Candidate | Votes | % | ±% |
| | Conservative | Edward Kirk | 483 | 42.7 | +25.0 |
| | Liberal Democrats | Nicholas Blakemore | 446 | 39.4 | −12.3 |
| | Labour | Adrian John Poole | 202 | 17.9 | n/a |
| Majority | 37 | 3.3 | |
| Turnout | 1,135 | 31.5 | +3.2 |
| | Conservative gain from Liberal Democrats | Swing | | |
Trowbridge Central
Trowbridge Central | Party | Candidate | Votes | % | ±% |
| | Liberal Democrats | Stewart Martin Palmen | 511 | 42.6 | +1.8 |
| | Conservative | John Roland Wallace Knight | 417 | 34.8 | +17.0 |
| | Labour | Phoebe Eliana Rosalind Kemp | 271 | 22.6 | +7.6 |
| Majority | 94 | 7.8 | |
| Turnout | 1,202 | 32.0 | +6.4 |
| | Liberal Democrats hold | Swing | | |
Trowbridge Drynham
Trowbridge Drynham | Party | Candidate | Votes | % | ±% |
| | Conservative | Graham David Payne | 654 | 66.3 | −5.8 |
| | Labour | Laura Michelle Pictor | 203 | 20.6 | n/a |
| | Liberal Democrats | John Richard Marsden | 130 | 13.2 | −14.7 |
| Majority | 451 | 45.5 | |
| Turnout | 992 | 31.2 | +7.7 |
| | Conservative hold | Swing | | |
Trowbridge Grove
Trowbridge Grove | Party | Candidate | Votes | % | ±% |
| | Conservative | David Edward Halik | 509 | 44.8 | +25.8 |
| | Liberal Democrats | Bob Brice | 457 | 40.2 | n/a |
| | Labour | Liz Gifford | 170 | 15.0 | n/a |
| Majority | 52 | 4.6 | |
| Turnout | 1,138 | 34.5 | |
| | Conservative gain from Independent | Swing | | |
Note: Chris Auckland had previously gained the seat for the Liberal Democrats in a 2016 by-election.
Trowbridge Lambrok
Trowbridge Lambrok | Party | Candidate | Votes | % | ±% |
| | Conservative | Deborah Ann Halik | 488 | 45.5 | +13.8 |
| | Liberal Democrats | Ben Midgley | 344 | 32.1 | n/a |
| | Labour | Shaun Samuel James Henley | 165 | 15.4 | n/a |
| | Green | Marie Hillcoat | 75 | 7.0 | n/a |
| Majority | 144 | 13.4 | |
| Turnout | 1,075 | 29.3 | +2.3 |
| | Conservative gain from Independent | Swing | | |
Trowbridge Park
Trowbridge Park | Party | Candidate | Votes | % | ±% |
| | Conservative | Peter Fuller | 551 | 47.8 | +7.6 |
| | Independent | Dennis Paul Drewett | 213 | 18.5 | −24.6 |
| | Labour | Jackie Harding | 199 | 17.3 | n/a |
| | Liberal Democrats | Roger Guy Andrews | 190 | 16.5 | −0.2 |
| Majority | 338 | 29.2 | |
| Turnout | 1,158 | 31.3 | +6.1 |
| | Conservative gain from Independent | Swing | | |
Trowbridge Paxcroft
Trowbridge Paxcroft | Party | Candidate | Votes | % | ±% |
| | Liberal Democrats | Stephen John Oldrieve | 750 | 54.5 | −11.1 |
| | Conservative | James Rothschild St Clair | 516 | 37.5 | +3.1 |
| | Labour | Maria Adlam-Apps | 110 | 8.0 | n/a |
| Majority | 234 | 17.0 | |
| Turnout | 1,379 | 30.8 | +1.5 |
| | Liberal Democrats hold | Swing | | |
Urchfont and The Cannings
Urchfont and The Cannings | Party | Candidate | Votes | % | ±% |
| | Conservative | Philip Whitehead | 1,156 | 71.8 | +22.1 |
| | Liberal Democrats | John Nicholas Merrett | 256 | 15.9 | n/a |
| | Labour | Amanda Hopgood | 199 | 12.4 | −4.5 |
| Majority | 900 | 55.1 | |
| Turnout | 1,633 | 42.4 | +5.3 |
| | Conservative hold | Swing | | |
Warminster Broadway
Warminster Broadway | Party | Candidate | Votes | % | ±% |
| | Conservative | Tony Jackson | 665 | 49.5 | −5.1 |
| | Independent | Paul Batchelor | 335 | 24.9 | n/a |
| | Labour | Eden Morris | 173 | 12.9 | n/a |
| | Liberal Democrats | Martin David John Papworth | 171 | 12.7 | n/a |
| Majority | 330 | 24.5 | |
| Turnout | 1,349 | 36.8 | +6.3 |
| | Conservative hold | Swing | | |
Warminster Copheap and Wylye
Warminster Copheap and Wylye | Party | Candidate | Votes | % | ±% |
| | Conservative | Christopher Newbury | 1,046 | 74.6 | +3.3 |
| | Liberal Democrats | Ryan John Ellis Bird | 204 | 14.5 | n/a |
| | Labour | Nicola Clare Grove | 153 | 10.9 | n/a |
| Majority | 842 | 59.5 | |
| Turnout | 1,416 | 39.9 | +8.5 |
| | Conservative hold | Swing | | |
Warminster East
Warminster East | Party | Candidate | Votes | % | ±% |
| | Conservative | Andrew Davis | 734 | 48.3 | +8.7 |
| | Independent | Paul Ian MacDonald | 480 | 31.6 | −2.3 |
| | Labour | Eleanor May Free | 136 | 9.0 | n/a |
| | Liberal Democrats | Nigel Paul Hampson | 109 | 7.2 | n/a |
| | Green | Maggie Richens | 60 | 4.0 | n/a |
| Majority | 254 | 16.6 | |
| Turnout | 1,528 | 36.1 | +3.9 |
| | Conservative hold | Swing | | |
Warminster West
Warminster West | Party | Candidate | Votes | % | ±% |
| | Conservative | Pip Ridout | 694 | 58.4 | n/a |
| | Independent | Stacie Allensby | 189 | 15.9 | n/a |
| | Liberal Democrats | Andy Hinchcliffe | 152 | 12.8 | n/a |
| | Green | Carrie Moyes | 90 | 7.6 | n/a |
| | Labour | Tony Free | 64 | 5.4 | n/a |
| Majority | 505 | 42.3 | |
| Turnout | 1,193 | 28.7 | n/a |
| | Conservative hold | Swing | | |
Warminster Without
Warminster Without | Party | Candidate | Votes | % | ±% |
| | Conservative | Fleur de Rhé-Philipe | 1,014 | 73.3 | +0.9 |
| | Liberal Democrats | Jonathan Whitehead-Whiting | 214 | 15.5 | n/a |
| | Labour | Anthony Paul Tyler | 156 | 11.3 | −11/4 |
| Majority | 658 | 49.3 | |
| Turnout | 1,334 | 39.4 | +7.3 |
| | Conservative hold | Swing | | |
West Selkley
West Selkley | Party | Candidate | Votes | % | ±% |
| | Conservative | Jane Frances Davies | 933 | 70.2 | −7.1 |
| | Liberal Democrats | Sara Elizabeth Spratt | 275 | 20.7 | n/a |
| | Labour | Matthew James Bowman Lee | 122 | 9.2 | n/a |
| Majority | 800 | 57.8 | |
| Turnout | 1,385 | 40.3 | +4.4 |
| | Conservative hold | Swing | | |
Westbury East
Westbury East | Party | Candidate | Votes | % | ±% |
| | Liberal Democrats | Gordon Ian King | 661 | 47.1 | +5.4 |
| | Conservative | Rupert Ashley Lescott | 607 | 43.2 | +26.5 |
| | Labour | Mike Kettlety | 137 | 9.8 | n/a |
| Majority | 54 | 3.8 | |
| Turnout | 1,408 | 37.1 | +5.3 |
| | Liberal Democrats hold | Swing | | |
Westbury North
Westbury North | Party | Candidate | Votes | % | ±% |
| | Liberal Democrats | David Jenkins | 596 | 57.9 | +3.8 |
| | Conservative | David Lancashire | 299 | 29.1 | +16.7 |
| | Labour | Michael Sutton | 134 | 13.0 | +1.3 |
| Majority | 297 | 28.8 | |
| Turnout | 1,033 | 29.1 | +1.8 |
| | Liberal Democrats hold | Swing | | |
Westbury West
Westbury West | Party | Candidate | Votes | % | ±% |
| | Independent | Russell Mark Jonathan Hawker | 352 | 33.4 | −4.7 |
| | Conservative | Nick Stovold | 301 | 28.6 | +15.5 |
| | Liberal Democrats | Carole King | 260 | 24.7 | +19.1 |
| | Labour | Jane Francesca Russ | 111 | 10.5 | −4.6 |
| | Green | Margaret Frances Cavanna | 29 | 2.8 | n/a |
| Majority | 51 | 4.8 | |
| Turnout | 1,053 | 27.1 | +5.1 |
| | Independent hold | Swing | | |
Wilton and Lower Wylye Valley
Wilton and Lower Wylye Valley | Party | Candidate | Votes | % | ±% |
| | Conservative | Pauline Elizabeth Church | 760 | 46.0 | +12.3 |
| | Liberal Democrats | Peter Derek Edge | 692 | 41.9 | −15.1 |
| | Labour | Olivia McLennan | 200 | 12.1 | +2.8 |
| Majority | 68 | 4.1 | |
| Turnout | 1,661 | 43.3 | +10.0 |
| | Conservative gain from Liberal Democrats | Swing | | |
Winsley and Westwood
Winsley and Westwood | Party | Candidate | Votes | % | ±% |
| | Conservative | Johnny Kidney | 1,040 | 56.9 | +15.7 |
| | Liberal Democrats | Magnus Ian Macdonald | 788 | 43.1 | −3.0 |
| Majority | 252 | 13.7 | |
| Turnout | 1,836 | 55.2 | +11.8 |
| | Conservative gain from Liberal Democrats | Swing | | |
Winterslow
Winterslow | Party | Candidate | Votes | % | ±% |
| | Independent | Christopher Devine | 775 | 47.2 | n/a |
| | Conservative | Christopher Duncan Miller | 590 | 35.9 | n/a |
| | Liberal Democrats | Colin Richard Baxter | 159 | 9.7 | n/a |
| | Green | Alice Jean Kiff | 74 | 4.5 | n/a |
| | Labour | Ian Martingale | 45 | 2.7 | n/a |
| Majority | 185 | 11.2 | |
| Turnout | 1,645 | 51.9 | |
| | Independent gain from Conservative | Swing | | |
Note: In 2013, Christopher Devine had won the seat unopposed as a Conservative candidate.
By-elections between 2017 and 2021
Trowbridge Drynham
Trowbridge Drynham By-Election 4 July 2019[5] | Party | Candidate | Votes | % | ±% |
| | Liberal Democrats | Andrew James Bryant | 431 | 41.6 | +28.4 |
| | Conservative | Khamal Akeem Reynolds | 316 | 30.5 | –35.8 |
| | Independent | John Roland Wallace Knight | 246 | 23.7 | +23.7 |
| | Labour | Shaun Samuel James Henley | 44 | 4.2 | –16.4 |
| Majority | 115 | 11.1 | |
| Turnout | 1,038 | 33 | |
| | Liberal Democrats gain from Conservative | Swing | +32.1 | |
Westbury North
Westbury North By-Election 18 July 2019[6] | Party | Candidate | Votes | % | ±% |
| | Liberal Democrats | Carole King | 488 | 52.4 | –5.6 |
| | Independent | Ian Cunningham | 231 | 24.8 | n/a |
| | Conservative | Antonio Piazza | 140 | 15.0 | –14.0 |
| | Labour | Jane Russ | 57 | 6.1 | –6.9 |
| | Independent | Francis Morland | 16 | 1.7 | n/a |
| Majority | 257 | 27.6 | |
| Turnout | 936 | 24.43 | |
| | Liberal Democrats hold | Swing | +4.2 | |
Ethandune
Ethandune By-Election 19 September 2019[7] | Party | Candidate | Votes | % | ±% |
| | Conservative | Suzanne Grahem Wickham | 778 | 57.0 | –14.8 |
| | Liberal Democrats | Alan Charles Rankin | 587 | 43.0 | +14.8 |
| Majority | 191 | 14.0 | |
| Turnout | 1,371 | 38.01 | |
| | Conservative hold | Swing | –14.8 | |
Melksham Without South
Melksham Without South By-Election 24 October 2019[8] | Party | Candidate | Votes | % | ±% |
| | Conservative | Nicholas James Holder | 593 | 60.4 | +5.1 |
| | Liberal Democrats | Vanessa Fiorelli | 388 | 39.6 | +21.5 |
| Majority | 205 | 20.9 | –16.1 |
| Turnout | 992 | 24.8 | |
| | Conservative hold | Swing | –8.2 | |
Trowbridge Lambrok
Trowbridge Lambrok By-Election 28 November 2019[9] | Party | Candidate | Votes | % | ±% |
| | Liberal Democrats | Joanne Lisa Trigg | 622 | 57.5 | +25.4 |
| | Conservative | David Charles Cavill | 455 | 42.1 | –3.4 |
| Majority | 167 | 15.4 | |
| Turnout | 1,081 | 29.53 | |
| | Liberal Democrats gain from Conservative | Swing | +14.4 | |
Till and Wylye Valley
Till and Wylye Valley By-Election 10 March 2020[10] | Party | Candidate | Votes | % | ±% |
| | Conservative | Kevin Stuart Daley | 637 | 49.6 | –4.6 |
| | Liberal Democrats | Harry David Ashcroft | 623 | 48.5 | +4.4 |
| | Labour | Timothy John Treslove | 24 | 1.9 | +0.3 |
| Majority | 14 | 1.1 | –9.0 |
| Turnout | 1,286 | 35.6 | –22.2 |
| | Conservative hold | Swing | –4.5 | |
By-election not held
Jane Scott retired as councillor for By Brook in February 2020, following her appointment as a government whip in the House of Lords.[4] In March 2020, a by-election to take place on 2 April was announced. Nick Botterill was selected to stand for the Conservatives, Lesley Bennet for the Liberal Democrats.[11] However, later in March the by-election was cancelled by the Returning Officer, due to COVID-19 lockdown guidance.[12][13]
The seat remained vacant[14] until the Wiltshire Council election in May 2021, when Botterill was elected.
References
- ^ "Upcoming elections & referendums". Electoral Commission. Archived from the original on 5 May 2018. Retrieved 15 September 2016.
- ^ Bulford, Allington and Figheldean election 2017 at wiltshire.gov.uk, accessed 30 September 2020
- ^ "Unitary council election on Thursday 4 May 2017". Wiltshire Council. 11 May 2017. Retrieved 11 May 2017.
- ^ a b "Councillor resigns following appointment to Government role". Wiltshire Council. 18 February 2020. Retrieved 20 March 2021.
- ^ Declaration of Result of Poll Archived 10 September 2020 at the Wayback Machine at Wiltshire.gov.uk
- ^ "Wiltshire Local Election". Democracy Club. Retrieved 19 July 2019.
- ^ "Declaration of Result of Poll" (PDF). wiltshire.gov.uk. Wiltshire Council. Archived from the original (PDF) on 10 September 2020. Retrieved 20 September 2019.
- ^ "Declaration of Result of Poll" (PDF). wiltshire.gov.uk. Wiltshire Council. Archived from the original (PDF) on 10 September 2020. Retrieved 27 October 2019.
- ^ Declaration of Result of Poll Archived 10 September 2020 at the Wayback Machine at Wiltshire.gov.uk
- ^ "Declaration of Result of Poll". wiltshire.gov.uk. Wiltshire Council. Archived from the original on 10 September 2020. Retrieved 11 March 2020.
- ^ Matthew McLaughlin, "By-election: Meet the two By Brook candidates", wiltshiretimes.co.uk, 17 March 2020, accessed 25 April 2020
- ^ "SUSPENDED: Unitary council by-election for By Brook Unitary Division on Thursday 2 April 2020", wiltshire.gov.uk, 2 April 2020
- ^ Matthew McLaughlin, "By Brook by-election suspended due to Coronavirus", Gazette and Herald, 23 March 2020, accessed 25 April 2021
- ^ "Councillor details - By Brook Division Vacancy". Wiltshire Council. 20 March 2021. Archived from the original on 6 March 2021. Retrieved 20 March 2021.
External links
"Statement of Persons Nominated", 4 April 2017, Marlborough Town Council


 Council elections in Wiltshire


