2005 UK local government election
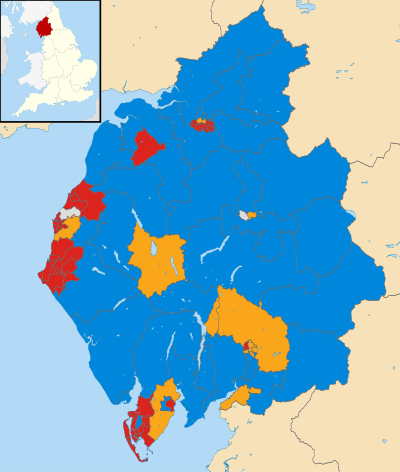
Elections to Cumbria County Council were held on 5 May 2005. This was on the same day as other UK county council elections. The Labour Party lost their majority and the council fell under no overall control.
Results
2005 Cumbria County Council election[1][2] | Party | Seats | Gains | Losses | Net gain/loss | Seats % | Votes % | Votes | +/− |
| | Labour | 39 | 3 | 4 |  1 1 | 46.4 | 36.1% | 84,482 | 1.4 |
| | Conservative | 32 | 3 | 3 | 1 | 38.1 | 38.7% | 90,794 | 0.5 |
| | Liberal Democrats | 11 | 3 | 3 |  1 1 | 13.1 | 19.6% | 45,885 | 2.0 |
| | Independent | 2 | 1 | 0 | 1 | 2.4 | 4.7% | 11,035 | 1.3 |
| | Socialist People's Party | 0 | 0 | 0 |  | 0.0 | 0.4% | 826 | 3.0 |
| | Green | 0 | 0 | 0 | | 0.0 | 0.2% | 499 | 0.0 |
| | UKIP | 0 | 0 | 0 | | 0.0 | 0.1% | 312 | New |
| | English Democrat | 0 | 0 | 0 | | 0.0 | 0.1% | 269 | New |
| | Local Community Party | 0 | 0 | 0 | | 0.0 | 0.1% | 224 | New |
Results by electoral division
Allerdale District
Aspatria & Wharrels
Aspatria & Wharrels (1 seat)[3][4] | Party | Candidate | Votes | % |
| | Conservative | James Buchanan | 1,609 | 48.4% |
| | Labour | Carneen McCarron-Holmes | 997 | 30.0% |
| | Liberal Democrats | Eric Burgess | 717 | 21.6% |
| Majority | 612 | 18.4% |
| Turnout | 3,323 | 64.1% |
| | Conservative hold |
Bowness Thursby & Caldbeck
Bowness Thursby & Caldbeck (1 seat)[3][4] | Party | Candidate | Votes | % |
| | Conservative | Duncan Fairbairn | 1,969 | 62.2% |
| | Liberal Democrats | Olwyn Luckley | 1,195 | 37.8% |
| Majority | 774 | 24.5% |
| Turnout | 3,164 | 64.0% |
| | Conservative hold |
Cockermouth East
Cockermouth East (1 seat)[3][4] | Party | Candidate | Votes | % |
| | Conservative | Eric Nicholson | 1,789 | 54.9% |
| | Labour | Alan Smith | 1,471 | 45.1% |
| Majority | 318 | 9.8% |
| Turnout | 3,260 | 67.4% |
| | Conservative hold |
Cockermouth West
Cockermouth West (1 seat)[3][4] | Party | Candidate | Votes | % |
| | Conservative | Timothy Heslop | 1,550 | 55.9% |
| | Labour | William Bacon | 1,221 | 44.1% |
| Majority | 329 | 11.9% |
| Turnout | 2,771 | 65.6% |
| | Conservative hold |
Dearham and Broughton
Dearham and Broughton (1 seat)[3][4] | Party | Candidate | Votes | % |
| | Labour | Alan Clark | 2,031 | 59.0% |
| | Conservative | Christopher Harris | 1,412 | 41.0% |
| Majority | 619 | 18.0% |
| Turnout | 3,443 | 64.9% |
| | Labour hold |
Harrington, Clifton and Stainburn
Harrington, Clifton and Stainburn (1 seat)[3][4] | Party | Candidate | Votes | % |
| | Liberal Democrats | Allan Caine | 1,603 | 52.5% |
| | Labour | Joseph Holliday | 1,450 | 47.5% |
| Majority | 153 | 5.0% |
| Turnout | 3,053 | 60.3% |
| | Liberal Democrats gain from Labour |
Keswick & Derwent
Keswick & Derwent (1 seat)[3][4] | Party | Candidate | Votes | % |
| | Liberal Democrats | Elizabeth Barraclough | 1,602 | 45.6% |
| | Conservative | Ronald Munby | 1,099 | 31.3% |
| | Labour | Denstone Kemp | 810 | 23.1% |
| Majority | 503 | 14.3% |
| Turnout | 3,511 | 66.3% |
| | Liberal Democrats gain from Conservative |
Maryport East
Maryport East (1 seat)[3][4] | Party | Candidate | Votes | % |
| | Labour | Keith Little | 2,044 | 82.9% |
| | Conservative | Derick Pattinson | 421 | 17.1% |
| Majority | 1,623 | 65.8% |
| Turnout | 2,465 | 54.6% |
| | Labour hold |
Maryport West
Maryport West (1 seat)[3][4] | Party | Candidate | Votes | % |
| | Labour | William Cameron | 1,706 | 73.5% |
| | Conservative | Neville Lishman | 615 | 26.5% |
| Majority | 1,091 | 47.0% |
| Turnout | 2,321 | 58.1% |
| | Labour hold |
Moorclose
Moss Bay and Moorclose (1 seat)[3][4] | Party | Candidate | Votes | % |
| | Labour | Gerald Humes | 1,358 | 71.1% |
| | Liberal Democrats | Christine Johanssen | 551 | 28.9% |
| Majority | 807 | 42.3% |
| Turnout | 1,909 | 57.4% |
| | Labour hold |
Moss Bay
Moss Bay (1 seat)[3][4] | Party | Candidate | Votes | % |
| | Labour | Barbara Cannon | 1,172 | 78.8% |
| | Liberal Democrats | Robert Hardon | 316 | 21.2% |
| Majority | 856 | 57.5% |
| Turnout | 1,488 | 49.5% |
| | Labour hold |
Seaton
Seaton (1 seat)[3][4] | Party | Candidate | Votes | % |
| | Independent | Trevor Fee | 1,202 | 51.3% |
| | Labour | John Ardron | 1,140 | 48.7% |
| Majority | 62 | 2.6% |
| Turnout | 2,342 | 59.1% |
| | Independent gain from Labour |
Solway Coast
Solway Coast (1 seat)[3][4] | Party | Candidate | Votes | % |
| | Conservative | Anthony Markley | 1,269 | 40.3% |
| | Labour | Robert Allison | 1,127 | 35.8% |
| | Independent | William Jefferson | 749 | 23.8% |
| Majority | 142 | 4.5% |
| Turnout | 3,145 | 63.0% |
| | Conservative gain from Labour |
St John's
St John's and Great Clifton (1 seat)[3][4] | Party | Candidate | Votes | % |
| | Labour | James Samson | 1,345 | 57.8% |
| | Conservative | John Heathcote | 984 | 42.2% |
| Majority | 361 | 15.5% |
| Turnout | 2,329 | 59.5% |
| | Labour hold |
St Michaels
St Michael's (1 seat)[3][4] | Party | Candidate | Votes | % |
| | Labour | Alan Barry | 1,282 | 62.7% |
| | Liberal Democrats | Ian Francis | 763 | 37.3% |
| Majority | 519 | 25.4% |
| Turnout | 2,045 | 59.4% |
| | Labour hold |
Wigton
Wigton (1 seat)[3][4] | Party | Candidate | Votes | % |
| | Labour | John Crouch | 856 | 32.1% |
| | Conservative | Stuart Moffat | 804 | 33.9% |
| | Independent | George Scott | 711 | 30.0% |
| | Liberal Democrats | Jacqueline Forsyth | 299 | 12.6% |
| Majority | 52 | 1.9% |
| Turnout | 2,670 | 56.6% |
| | Labour gain from Conservative |
Barrow-in-Furness
Dalton North
Dalton North (1 seat)[3][4] | Party | Candidate | Votes | % |
| | Labour | Peter Phizacklea | 1,495 | 54.5% |
| | Conservative | William James Crosthwaite | 1,246 | 45.5% |
| Majority | 249 | 9.1% |
| Turnout | 2,741 | 58.1% |
| | Labour hold |
Dalton South
Dalton South (1 seat)[3][4] | Party | Candidate | Votes | % |
| | Labour | William Smith | 1,215 | 47.7% |
| | Conservative | Frank Murray | 985 | 38.7% |
| | Independent | Helene Young | 348 | 13.7% |
| Majority | 230 | 9.0% |
| Turnout | 2,548 | 57.9% |
| | Labour hold |
Hawcoat
Hawcoat (1 seat)[3][4] | Party | Candidate | Votes | % |
| | Conservative | John Richardson | 1,924 | 67.3% |
| | Labour | Tricia Kegg | 935 | 32.7% |
| Majority | 989 | 34.6% |
| Turnout | 2,859 | 67.9% |
| | Conservative hold |
Hindpool
Hindpool (1 seat)[3][4] | Party | Candidate | Votes | % |
| | Conservative | Anne Burns | 1,327 | 73.2% |
| | Labour | John Murray | 485 | 26.8% |
| Majority | 842 | 46.5% |
| Turnout | 1,812 | 46.5% |
| | Conservative hold |
Newbarns
Newbarns (1 seat)[3][4] | Party | Candidate | Votes | % |
| | Labour | John Murphy | 1,106 | 44.8% |
| | Conservative | William Pears | 1,067 | 43.2% |
| | Independent | James Tongue | 295 | 12.0% |
| Majority | 39 | 1.6% |
| Turnout | 2,468 | 60.0% |
| | Labour gain from Conservative |
Old Barrow
Old Barrow (1 seat)[3][4] | Party | Candidate | Votes | % |
| | Labour | Clive Kitchen | 657 | 43.4% |
| | Independent | Eric Wood | 645 | 42.6% |
| | Socialist People's Party | Rosemarie Hamezeian | 211 | 13.9% |
| Majority | 12 | 0.8% |
| Turnout | 1,513 | 47.9% |
| | Labour hold |
Ormsgill
Ormsgill (1 seat)[3][4] | Party | Candidate | Votes | % |
| | Labour | Ernest Wilson | 954 | 49.0% |
| | Socialist People's Party | Jim Hamezeian | 615 | 31.6% |
| | Conservative | Tina Macur | 376 | 19.3% |
| Majority | 339 | 17.4% |
| Turnout | 1,945 | 50.8% |
| | Labour hold |
Parkside
Parkside (1 seat)[3][4] | Party | Candidate | Votes | % |
| | Labour | Alan Nicholson | 1,307 | 58.9% |
| | Conservative | Shirley Richardson | 913 | 41.1% |
| Majority | 394 | 17.7% |
| Turnout | 2,220 | 58.0% |
| | Labour hold |
Risedale
Risedale (1 seat)[3][4] | Party | Candidate | Votes | % |
| | Labour | Kevin Hamilton | 1,654 | 71.9% |
| | Conservative | Desmond English | 645 | 28.1% |
| Majority | 1,009 | 43.9% |
| Turnout | 2,299 | 49.3% |
| | Labour hold |
Roosecote
Roosecote (1 seat)[3][4] | Party | Candidate | Votes | % |
| | Labour | Norman Shaw | 1,057 | 38.5% |
| | Conservative | Kenneth Williams | 1,052 | 38.3% |
| | Liberal Democrats | Alan Titcombe | 635 | 23.1% |
| Majority | 5 | 0.2% |
| Turnout | 2,744 | 63.2% |
| | Labour hold |
Walney North
Walney North (1 seat)[3][4] | Party | Candidate | Votes | % |
| | Labour | Jane Murphy | 1,315 | 58.6% |
| | Conservative | Brenda Lauderdale | 632 | 28.2% |
| | Independent | Kenneth Arts | 298 | 13.3% |
| Majority | 683 | 30.4% |
| Turnout | 2,245 | 54.8% |
| | Labour hold |
Walney South
Walney South (1 seat)[3][4] | Party | Candidate | Votes | % |
| | Labour | Jeffrey Garnett | 1,211 | 50.1% |
| | Conservative | Graham Pritchard | 786 | 32.5% |
| | Independent | Stephen Smart | 315 | 13.0% |
| | Independent | Thomas Weall | 103 | 4.3% |
| Majority | 425 | 17.6% |
| Turnout | 2,415 | 58.5% |
| | Labour hold |
Carlisle
Belah
Belah (1 seat)[3][4] | Party | Candidate | Votes | % |
| | Conservative | Alan Toole | 1,644 | 53.9% |
| | Labour | Joseph Hendry | 1,284 | 42.1% |
| | Local Community Party | Mark Gibson | 124 | 4.1% |
| Majority | 360 | 11.8% |
| Turnout | 3,052 | 63.4% |
| | Conservative hold |
Belle Vue
Belle Vue (1 seat)[3][4] | Party | Candidate | Votes | % |
| | Labour | Cyril Weber | 1,200 | 49.7% |
| | Conservative | George Bain | 745 | 30.9% |
| | Liberal Democrats | James Tootle | 411 | 17.0% |
| | Local Community Party | John Peacock | 57 | 2.4% |
| Majority | 455 | 18.9% |
| Turnout | 2,413 | 57.4% |
| | Labour hold |
Botcherby
Botcherby (1 seat)[3][4] | Party | Candidate | Votes | % |
| | Labour | Anne Glendinning | 1,456 | 71.1% |
| | Conservative | Teresa Cartner | 591 | 28.9% |
| Majority | 865 | 42.3% |
| Turnout | 2,047 | 45.5% |
| | Labour hold |
Brampton & Gilsland
Brampton & Gilsland (1 seat)[3][4] | Party | Candidate | Votes | % |
| | Conservative | Philip Howard | 1,370 | 47.8% |
| | Labour | Alex Faulds | 809 | 28.2% |
| | Liberal Democrats | Alan Marsden | 689 | 24.0% |
| Majority | 561 | 19.6% |
| Turnout | 2,868 | 55.1% |
| | Conservative hold |
Castle
Castle (1 seat)[3][4] | Party | Candidate | Votes | % |
| | Liberal Democrats | Thomas Hodgson | 937 | 43.8% |
| | Labour | Jessica Riddle | 853 | 39.9% |
| | Conservative | Pamela Smith | 349 | 16.3% |
| Majority | 84 | 3.9% |
| Turnout | 2,139 | 50.6% |
| | Liberal Democrats hold |
Currock
Corby and Hayton (1 seat)[3][4] | Party | Candidate | Votes | % |
| | Labour | Heather Bradley | 1,414 | 61.7% |
| | Conservative | Lawrence Fisher | 510 | 22.3% |
| | Liberal Democrats | Marjorie Richardson | 366 | 16.0% |
| Majority | 904 | 39.5% |
| Turnout | 2,290 | 52.7% |
| | Labour hold |
Dalston & Cummersdale
Dalston and Burgh (1 seat)[3][4] | Party | Candidate | Votes | % |
| | Conservative | John Collier | 2,057 | 50.6% |
| | Labour | Ann Warwick | 1,042 | 25.6% |
| | Liberal Democrats | William Wyllie | 968 | 23.8% |
| Majority | 1,015 | 25.0% |
| Turnout | 4,067 | 68.4% |
| | Conservative hold |
Denton Holme
Denton Holme (1 seat)[3][4] | Party | Candidate | Votes | % |
| | Labour | Hugh McDevitt | 1,587 | 61.7% |
| | Conservative | Doreen Parsons | 543 | 21.1% |
| | Liberal Democrats | Ronald Struthers | 442 | 17.2% |
| Majority | 1,044 | 40.6% |
| Turnout | 2,572 | 55.1% |
| | Labour hold |
Harraby
Harraby North (1 seat)[3][4] | Party | Candidate | Votes | % |
| | Labour | Michael Richardson | 1,423 | 56.1% |
| | Conservative | Andrew Stevenson | 691 | 27.2% |
| | Liberal Democrats | Olive Hall | 423 | 16.7% |
| Majority | 732 | 28.9% |
| Turnout | 2,537 | 55.1% |
| | Labour hold |
Longtown & Bewcastle
Longtown & Bewcastle (1 seat)[3][4] | Party | Candidate | Votes | % |
| | Conservative | Geoffrey Prest | 1,417 | 52.6% |
| | Labour | Robert Dodds | 769 | 28.5% |
| | Liberal Democrats | Jennifer Gallagher | 509 | 18.9% |
| Majority | 648 | 24.0% |
| Turnout | 2,695 | 53.1% |
| | Conservative hold |
Morton
Morton (1 seat)[3][4] | Party | Candidate | Votes | % |
| | Labour | John Bell | 1,540 | 49.9% |
| | Conservative | John Farmer | 1,102 | 35.7% |
| | Liberal Democrats | John Farmer | 404 | 13.1% |
| | Local Community Party | Lezley Gibson | 43 | 1.4% |
| Majority | 438 | 14.2% |
| Turnout | 3,089 | 63.9% |
| | Labour gain from Liberal Democrats |
St Aidans
St Aidans (1 seat)[3][4] | Party | Candidate | Votes | % |
| | Labour | Reginald Watson | 1,518 | 63.3% |
| | Conservative | James Bainbridge | 880 | 36.7% |
| Majority | 638 | 26.6% |
| Turnout | 2,398 | 53.1% |
| | Labour hold |
Stanwix & Irthington
Stanwix & Irthington (1 seat)[3][4] | Party | Candidate | Votes | % |
| | Conservative | John Mallinson | 1,760 | 51.9% |
| | Independent | William Graham | 1,632 | 48.1% |
| Majority | 128 | 3.8% |
| Turnout | 3,392 | 66.5% |
| | Conservative hold |
Stanwix Urban
Stanwix Urban (1 seat)[3][4] | Party | Candidate | Votes | % |
| | Conservative | Elizabeth Mallinson | 1,736 | 54.1% |
| | Labour | George Stothard | 1,475 | 45.9% |
| Majority | 261 | 8.1% |
| Turnout | 3,211 | 66.8% |
| | Conservative hold |
Upperby
Upperby (1 seat)[3][4] | Party | Candidate | Votes | % |
| | Labour | Stewart Young | 1,297 | 60.5% |
| | Conservative | Michael Clarke | 448 | 20.9% |
| | Liberal Democrats | James Osler | 398 | 18.6% |
| Turnout | 849 | 39.6% |
| Majority | 2,143 | 53.2% |
| | Labour hold |
Wetheral
Wetheral (1 seat)[3][4] | Party | Candidate | Votes | % |
| | Conservative | John Robinson | 2,206 | 64.7% |
| | Labour | Roger Horne | 1,205 | 35.3% |
| Majority | 1,001 | 29.3% |
| Turnout | 3,411 | 61.3% |
| | Conservative hold |
Yewdale
Yewdale (1 seat)[3][4] | Party | Candidate | Votes | % |
| | Labour | Helen Marion Horne | 1,890 | 61.1% |
| | Conservative | Gareth Ellis | 1,202 | 38.9% |
| Majority | 688 | 22.3% |
| Turnout | 3,092 | 63.1% |
| | Labour hold |
Copeland
Bransty
Bransty (1 seat)[3][4] | Party | Candidate | Votes | % |
| | Labour | Bernard William Kirk | 1,746 | 64.4% |
| | Conservative | David Hill | 964 | 35.6% |
| Majority | 782 | 28.9% |
| Turnout | 2,710 | 55.7% |
| | Labour hold |
Cleator Moor North and Frizington
Cleator Moor North and Frizington (1 seat)[3][4] | Party | Candidate | Votes | % |
| | Labour | Timothy Knowles | 2,082 | 71.4% |
| | Conservative | Alexander Carroll | 834 | 28.6% |
| Majority | 1,248 | 42.8% |
| Turnout | 2,916 | 55.0% |
| | Labour hold |
Cleator Moor South & Egremont
Cleator Moor South & Egremont (1 seat)[3][4] | Party | Candidate | Votes | % |
| | Labour | Simon Leyton | 1,990 | 63.9% |
| | Conservative | Jean Lewthwaite | 1,126 | 36.1% |
| Majority | 864 | %27.7% |
| Turnout | 3,116 | 59.8% |
| | Labour hold |
Distington & Moresby
Distington & Moresby (1 seat)[3][4] | Party | Candidate | Votes | % |
| | Labour | Archibald Ross | 1,522 | 65.1% |
| | Conservative | George Higgins | 817 | 34.9% |
| Majority | 705 | 30.1% |
| Turnout | 2,339 | 55.5% |
| | Labour hold |
Gosforth & Ennerdale
Gosforth & Ennerdale (1 seat)[3][4] | Party | Candidate | Votes | % |
| | Conservative | Norman Clarkson | 1,467 | 50.2% |
| | Labour | Peter Watson | 897 | 30.7% |
| | Liberal Democrats | Mike Minogue | 56,119.2% | |
| Majority | 570 | 19.5% |
| Turnout | 2,925 | 68.0% |
| | Conservative hold |
Hensingham & Arlecdon
Hensingham & Arlecdon (1 seat)[3][4] | Party | Candidate | Votes | % |
| | Labour | Ronald Calvin | 1,712 | 67.2% |
| | Conservative | Marie Simpson | 836 | 32.8% |
| Majority | 876 | 34.4% |
| Turnout | 2,548 | 57.0% |
| | Labour hold |
Hillcrest
Hillcrest and Hensingham (1 seat)[3][4] | Party | Candidate | Votes | % |
| | Labour | Judith Andersen | 1,237 | 46.9% |
| | Conservative | Alistair Norwood | 984 | 37.3% |
| | Liberal Democrats | Francis Hollowell | 419 | 15.9% |
| Majority | 253 | 9.6% |
| Turnout | 2,640 | 59.7% |
| | Labour hold |
Kells and Sandwith
Kells and Sandwith (1 seat)[3][4] | Party | Candidate | Votes | % |
| | Labour | Joseph McAllister | 1,367 | 65.8% |
| | Independent | Gordon Brown | 357 | 17.2% |
| | Conservative | Leah Higgins | 355 | 17.1% |
| Majority | 1,010 | 48.6% |
| Turnout | 2,079 | 53.3% |
| | Labour hold |
Millom
Millom (1 seat)[3][4] | Party | Candidate | Votes | % |
| | Conservative | Raymond Cole | 1,700 | 50.03% |
| | Labour | Roland Woodward | 1,698 | 49.97% |
| Majority | 2 | 0.06% |
| Turnout | 3,398 | 60.2% |
| | Conservative hold |
Mirehouse
Mirehouse (1 seat)[3][4] | Party | Candidate | Votes | % |
| | Labour | John Woolley | 1,357 | 74.2% |
| | Conservative | Marcus Swift | 473 | 25.8% |
| Majority | 884 | 48.3% |
| Turnout | 1,830 | 51.0% |
| | Labour hold |
Seascale & Whicham
Seascale & Whicham (1 seat)[3][4] | Party | Candidate | Votes | % |
| | Conservative | Susan Brown | 2,321 | 71.0% |
| | Labour | Allan Holliday | 946 | 29.0% |
| Majority | 1,375 | 42.1% |
| Turnout | 67.63,267 | % |
| | Conservative hold |
St Bees & Egremont
St Bees & Egremont (1 seat)[3][4] | Party | Candidate | Votes | % |
| | Labour | David Southward | 1,411 | 53.9% |
| | Conservative | Adrian Davis-Johnston | 940 | 35.9% |
| | English Democrat | Alan Mossop | 269 | 10.3% |
| Majority | 471 | 18.0% |
| Turnout | 2,620 | 60.6% |
| | Labour hold |
Eden
Alston and East Fellside
Alston and East Fellside (1 seat)[3][4] | Party | Candidate | Votes | % |
| | Conservative | Isa Henderson | 1,257 | 35.7% |
| | Independent | Bryan Metz | 1,028 | 29.2% |
| | Liberal Democrats | George Collinge | 775 | 22.0% |
| | Labour | Christopher Bagshaw | 463 | 13.1% |
| Majority | 229 | 6.5% |
| Turnout | 3,523 | 71.5% |
| | Conservative hold |
Appleby
Appleby (1 seat)[3][4] | Party | Candidate | Votes | % |
| | Conservative | Mary Warburton | 1,474 | 51.0% |
| | Liberal Democrats | Andrew Connell | 1,418 | 49.0% |
| Majority | 56 | 1.9% |
| Turnout | 2,892 | 65.2% |
| | Conservative hold |
Eden Lakes
Eden Lakes (1 seat)[3][4] | Party | Candidate | Votes | % |
| | Conservative | Roger Bird | 1,315 | 44.8% |
| | Liberal Democrats | Neil Hughes | 1,152 | 39.2% |
| | Independent | Jean Wildish | 470 | 16.0% |
| Majority | 163 | 5.5% |
| Turnout | 2,937 | 67.0% |
| | Conservative hold |
Greystoke and Hesket
Greystoke and Hesket (1 seat)[3][4] | Party | Candidate | Votes | % |
| | Conservative | Albert Richardson | 1,775 | 54.9% |
| | Liberal Democrats | David Leonard | 1,063 | 32.9% |
| | Independent | Peter Huddleston | 395 | 12.2% |
| Majority | 3,233 | 68.6% |
| Turnout | 712 | 22.0% |
| | Conservative hold |
Kirkby Stephen
Kirkby Stephen (1 seat)[3][4] | Party | Candidate | Votes | % |
| | Conservative | Timothy Stoddard | 1,334 | 42.4% |
| | Liberal Democrats | John Raw | 954 | 30.3% |
| | Independent | Jane Brook | 861 | 27.3% |
| Majority | 3,149 | 64.8% |
| Turnout | 380 | 12.1% |
| | Conservative hold |
Penrith East
Penrith East (1 seat)[3][4] | Party | Candidate | Votes | % |
| | Liberal Democrats | Michael Ash | 1,129 | 45.1% |
| | Conservative | Gordon Nicolson | 765 | 30.6% |
| | Labour | Keith Dovaston | 467 | 18.7% |
| | Independent | John Nicholson | 141 | 5.6% |
| Majority | 364 | 14.5% |
| Turnout | 2,502 | 55.7% |
| | Liberal Democrats hold |
Penrith North
Penrith North (1 seat)[3][4] | Party | Candidate | Votes | % |
| | Conservative | Philip Chappelhow | 1,132 | 39.0% |
| | Liberal Democrats | Andrew Bell | 1,034 | 35.6% |
| | Labour | Geoffrey Rockliffe-King | 432 | 14.9% |
| | Independent | Mary Robinson | 304 | 10.5% |
| Majority | 98 | 3.4% |
| Turnout | 2,902 | 63.8% |
| | Conservative hold |
Penrith Rural
Penrith Rural (1 seat)[3][4] | Party | Candidate | Votes | % |
| | Conservative | Gary Strong | 1,793 | 57.7% |
| | Liberal Democrats | Stuart Hughes | 850 | 27.4% |
| | Labour | Alison Crompton | 464 | 14.9% |
| Majority | 943 | 30.4% |
| Turnout | 3,107 | 69.4% |
| | Conservative hold |
Penrith West
Penrith West (1 seat)[3][4] | Party | Candidate | Votes | % |
| | Independent | Colin Nineham | 754 | 33.8% |
| | Conservative | John Thompson | 663 | 29.7% |
| | Liberal Democrats | Roger Burgin | 455 | 20.4% |
| | Labour | Eric Wilson | 360 | 16.1% |
| Majority | 91 | 4.1% |
| Turnout | 2,232 | 54.3% |
| | Independent hold |
South Lakeland
Cartmel
Cartmel (1 seat)[3][4] | Party | Candidate | Votes | % |
| | Conservative | Edward Walsh | 1,332 | 44.3% |
| | Liberal Democrats | David Birchall | 1,302 | 43.3% |
| | Labour | Marilyn Molloy | 374 | 12.4% |
| Majority | 30 | 1.0% |
| Turnout | 3,008 | 68.3% |
| | Conservative gain from Liberal Democrats |
Grange
Grange (1 seat)[3][4] | Party | Candidate | Votes | % |
| | Conservative | William Wearing | 1,973 | 53.7% |
| | Liberal Democrats | Jane Hall | 1,374 | 37.4% |
| | Labour | Laurence Scullard | 328 | 8.9% |
| Majority | 599 | 16.3% |
| Turnout | 3,675 | 74.0% |
| | Conservative hold |
High Furness
High Furness (1 seat)[3][4] | Party | Candidate | Votes | % |
| | Conservative | Oliver Pearson | 1,426 | 46.7% |
| | Liberal Democrats | Edward Davies | 1,265 | 41.5% |
| | Labour | Rae Cross | 360 | 11.8% |
| Majority | 161 | 5.3% |
| Turnout | 3,051 | 71.8% |
| | Conservative hold |
Kendal Castle
Kendal Castle (1 seat)[3][4] | Party | Candidate | Votes | % |
| | Liberal Democrats | Thomas Clare | 1,941 | 57.6% |
| | Conservative | Enid Robinson | 1,034 | 30.7% |
| | Labour | Charles Batteson | 395 | 11.7% |
| Majority | 907 | 26.9% |
| Turnout | 3,370 | 71.2% |
| | Liberal Democrats hold |
Kendal Highgate
Kendal Highgate (1 seat)[3][4] | Party | Candidate | Votes | % |
| | Liberal Democrats | Geoffrey Cook | 1,167 | 43.6% |
| | Labour | Martyn Jowett | 900 | 33.6% |
| | Conservative | Jaine Chisholm Caunt | 611 | 22.8% |
| Majority | 267 | 10.0% |
| Turnout | 2,678 | 62.5% |
| | Liberal Democrats gain from Labour |
Kendal Nether
Kendal Nether (1 seat)[3][4] | Party | Candidate | Votes | % |
| | Liberal Democrats | Leslie Lishman | 1,506 | 48.9% |
| | Labour | Paul Braithwaite | 791 | 25.7% |
| | Conservative | Karen Patrick | 781 | 25.4% |
| Majority | 715 | 23.2% |
| Turnout | 3,078 | 66.0% |
| | Liberal Democrats hold |
Kendal South
Kendal South (1 seat)[3][4] | Party | Candidate | Votes | % |
| | Conservative | Alan Bobbett | 1,480 | 42.2% |
| | Liberal Democrats | Graham Vincent | 1,443 | 41.2% |
| | Labour | Robert Rothwell | 478 | 13.6% |
| | Independent | Andrew Billson-Page | 103 | 2.9% |
| Majority | 37 | 1.1% |
| Turnout | 3,504 | 73.8% |
| | Conservative hold |
Kendal Strickland and Fell
Kendal Strickland and Fell (1 seat)[3][4] | Party | Candidate | Votes | % |
| | Labour | David Clarke | 1,434 | 45.3% |
| | Liberal Democrats | Stephen Coleman | 1,149 | 36.3% |
| | Conservative | Melvin Mackie | 582 | 18.4% |
| Majority | 285 | 9.0% |
| Turnout | 3,165 | 68.5% |
| | Labour hold |
Kent Estuary
Kent Estuary (1 seat)[3][4] | Party | Candidate | Votes | % |
| | Liberal Democrats | Ian Stewart | 2,038 | 52.5% |
| | Conservative | Andrew Coates | 1,526 | 39.3% |
| | Labour | Andrew Strang | 319 | 8.2% |
| Majority | 512 | 13.2% |
| Turnout | 3,883 | 75.0% |
| | Liberal Democrats hold |
Lakes
Lakes (1 seat)[3][4] | Party | Candidate | Votes | % |
| | Conservative | Brian Barton | 1,025 | 40.5% |
| | Liberal Democrats | Mandi Abrahams | 908 | 35.9% |
| | Independent | George Middleton | 324 | 12.8% |
| | Labour | Maureen Colquhoun | 275 | 10.9% |
| Majority | 117 | 4.6% |
| Turnout | 2,532 | 61.0% |
| | Conservative gain from Liberal Democrats |
Low Furness
Lower Kentdale (1 seat)[3][4] | Party | Candidate | Votes | % |
| | Conservative | John Hemingway | 1,636 | 53.4% |
| | Liberal Democrats | David Steel | 1,425 | 46.6% |
| Majority | 211 | 6.9% |
| Turnout | 3,061 | 65.2% |
| | Conservative hold |
Lower Kentdale
Lyth Valley (1 seat)[3][4] | Party | Candidate | Votes | % |
| | Conservative | Roger Bingham | 2,209 | 64.5% |
| | Liberal Democrats | Antony Jolley | 925 | 27.0% |
| | Labour | Peter Horner | 292 | 8.5% |
| Majority | 1,284 | 37.5% |
| Turnout | 3,426 | 74.3% |
| | Conservative hold |
Lyth Valley
Lyth Valley (1 seat)[3][4] | Party | Candidate | Votes | % |
| | Conservative | James Bland | 1,745 | 58.1% |
| | Liberal Democrats | Maureen Horner | 1,048 | 34.9% |
| | Labour | Robin Yates | 212 | 7.1% |
| Majority | 697 | 23.2% |
| Turnout | 3,005 | 73.0% |
| | Conservative hold |
Sedbergh and Kirkby Lonsdale
Sedbergh and Kirkby Lonsdale (1 seat)[3][4] | Party | Candidate | Votes | % |
| | Conservative | Joseph Nicholson | 1,914 | 57.1% |
| | Liberal Democrats | Sydney McLennan | 1,150 | 34.3% |
| | Labour | Diane Horner | 289 | 8.6% |
| Majority | 764 | 22.8% |
| Turnout | 3,353 | 71.5% |
| | Conservative hold |
Ulverston East
Ulverston East (1 seat)[3][4] | Party | Candidate | Votes | % |
| | Labour | Wendy Kolbe | 1,397 | 55.2% |
| | Conservative | Brian Wilkinson | 823 | 32.5% |
| | UKIP | Alan Beach | 312 | 12.3% |
| Majority | 574 | 22.7% |
| Turnout | 2,532 | 57.5% |
| | Labour hold |
Ulverston West
Ulverston West (1 seat)[3][4] | Party | Candidate | Votes | % |
| | Conservative | Pauline Halfpenny | 1,682 | 54.7% |
| | Labour | Bharath Rajan | 896 | 29.1% |
| | Green | Simon Filmore | 499 | 16.2% |
| Majority | 786 | 25.5% |
| Turnout | 3,077 | 69.3% |
| | Conservative hold |
Upper Kent
Upper Kent (1 seat)[3][4] | Party | Candidate | Votes | % |
| | Liberal Democrats | Stanley Collins | 1,755 | 54.5% |
| | Conservative | Patricia Bell | 1,189 | 36.9% |
| | Labour | Avril Dobson | 277 | 8.6% |
| Majority | 566 | 17.6% |
| Turnout | 3,221 | 72.5% |
| | Liberal Democrats hold |
Windermere
Windermere (1 seat)[3][4] | Party | Candidate | Votes | % |
| | Liberal Democrats | Joan Stocker | 1,858 | 55.0% |
| | Conservative | David Williams | 1,211 | 35.8% |
| | Labour | Yvonne Stewart-Taylor | 309 | 9.1% |
| Majority | 647 | 19.2% |
| Turnout | 3,378 | 69.2% |
| | Liberal Democrats hold |
References
- ^ a b "Local Election Summaries 2005". The Elections Centre. Retrieved 19 October 2019.
- ^ a b Andrew Teale. "Local Election Results 2005 - Cumbria". Local Elections Archive Project. Retrieved 19 October 2019.
- ^ a b c d e f g h i j k l m n o p q r s t u v w x y z aa ab ac ad ae af ag ah ai aj ak al am an ao ap aq ar as at au av aw ax ay az ba bb bc bd be bf bg bh bi bj bk bl bm bn bo bp bq br bs bt bu bv bw bx by bz ca cb cc cd ce cf "Election 2005". Cumbria County Council. Archived from the original on 30 December 2005.
- ^ a b c d e f g h i j k l m n o p q r s t u v w x y z aa ab ac ad ae af ag ah ai aj ak al am an ao ap aq ar as at au av aw ax ay az ba bb bc bd be bf bg bh bi bj bk bl bm bn bo bp bq br bs bt bu bv bw bx by bz ca cb cc cd ce cf "Cumbria County Council Election Results 1973-2009" (PDF). Elections Centre. Retrieved 18 October 2019.

 1
1  1
1 


