2005 UK local government election
2005 Lancashire County Council election
|
|
All 84 seats to Lancashire County Council
43 seats needed for a majority |
|---|
| | First party | Second party | Third party | | | | | | | Party | Labour | Conservative | Liberal Democrats | | Seats won | 44 | 31 | 6 | | Popular vote | 197,061 | 195,517 | 99,710 | | Percentage | 37.62% | 37.33% | 19.04% |
| | | Fourth party | Fifth party | Sixth party | | | | | | | Party | Green | Independent | Idle Toad | | Seats won | 1 | 1 | 1 | | Popular vote | 8,350 | 7,417 | 1,680 | | Percentage | 1.60% | 1.42% | 0.32 | |
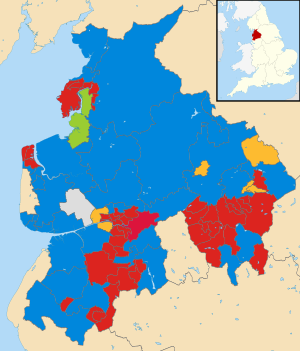 2005 local election results in Lancashire |
| | Council control after election
Labour Party
| |
Elections to Lancashire County Council were held on 5 May 2005, on the same day as the 2005 general election.
Each single-member ward in Lancashire was modified by boundary changes. No elections were held in Blackpool or Blackburn as they are unitary authorities outside of the county boundaries.
Result
Lancashire County Council Election Result 2005 | Party | Seats | Gains | Losses | Net gain/loss | Seats % | Votes % | Votes | +/− |
| | Labour | 44 | | | | 52.38 | 37.62 | 197,061 | |
| | Conservative | 31 | | | | 36.91 | 37.33 | 195,517 | |
| | Liberal Democrats | 6 | | | | 7.14 | 19.04 | 99,710 | |
| | Green | 1 | | | | 1.19 | 1.60 | 8,350 | |
| | Independent | 1 | | | | 1.19 | 1.42 | 7,417 | |
| | Idle Toad | 1 | | | | 1.19 | 0.32 | 1,680 | |
| | BNP | 0 | | | | 0.00 | 1.85 | 9,702 | |
| | Respect | 0 | | | | 0.00 | 0.53 | 2,795 | |
| | UKIP | 0 | | | | 0.00 | 0.29 | 1,531 | |
The overall turnout was 60.48% with a total of 523,763 valid votes cast. A total of 4,385 ballots were rejected.
Council composition
Following the election, the composition of the council was:
↓ | 44 | 31 | 6 | 1 | 1 | 1 |
| Labour | Conservative | Lib Dem | G | I | IT |
G - Green Party
I - Independent
IT - Idle Toad
Ward results
Burnley
Burnley Central East
Burnley Central East | Party | Candidate | Votes | % | ±% |
| | Labour | John Cavangh | 3,012 | 49.24 | |
| | Liberal Democrats | William Bennett | 2,169 | 35.46 | |
| | Conservative | David Tierney | 936 | 15.30 | |
| Majority | 843 | 13.78 | |
| Turnout | 6,117 | 53.58 | |
| | Labour win (new seat) |
Burnley Central West
Burnley Central West | Party | Candidate | Votes | % | ±% |
| | Labour | Tony Martin | 2,356 | 37.55 | |
| | Conservative | Peter Doyle | 1,477 | 23.54 | |
| | Liberal Democrats | Denise Embra | 1,339 | 21.34 | |
| | BNP | John Cave | 1,102 | 17.57 | |
| Majority | 879 | 14.01 | |
| Turnout | 6,274 | 58.73 | |
| | Labour win (new seat) |
Burnley North East
Burnley North East | Party | Candidate | Votes | % | ±% |
| | Labour | Terry Burns | 2,418 | 40.43 | |
| | Liberal Democrats | Martin Smith | 1,949 | 32.59 | |
| | BNP | David Shapcott | 838 | 14.01 | |
| | Conservative | Jeffrey Pickup | 776 | 12.97 | |
| Majority | 469 | 7.84 | |
| Turnout | 5,981 | 59.89 | |
| | Labour win (new seat) |
Burnley Rural
Burnley Rural | Party | Candidate | Votes | % | ±% |
| | Labour | Stephen Large | 2,410 | 31.94 | |
| | Conservative | David Heginbotham | 2,103 | 27.87 | |
| | Liberal Democrats | Peter McCann | 1,829 | 24.24 | |
| | BNP | David Thomson | 1,204 | 15.95 | |
| Majority | 307 | 4.07 | |
| Turnout | 7,546 | 66.17 | |
| | Labour win (new seat) |
Burnley South West
Burnley South West | Party | Candidate | Votes | % | ±% |
| | Labour | Maureen Martin | 2,411 | 36.61 | |
| | Liberal Democrats | Charles Bullas | 2,007 | 30.47 | |
| | BNP | Derek Dawson | 1,191 | 18.08 | |
| | Conservative | Ida Carmichael | 977 | 14.84 | |
| Majority | 404 | 6.14 | |
| Turnout | 6,586 | 58.56 | |
| | Labour win (new seat) |
Padiham and Burnley West
Padiham and Burnley West | Party | Candidate | Votes | % | ±% |
| | Labour | Marcus Johnstone | 2,377 | 37.98 | |
| | Liberal Democrats | Mary McCann | 1,393 | 22.26 | |
| | BNP | Sharon Wilkinson | 1,363 | 21.78 | |
| | Conservative | Laura Dowding | 1,125 | 17.98 | |
| Majority | 984 | 15.72 | |
| Turnout | 6,258 | 60.42 | |
| | Labour win (new seat) |
Chorley
Chorley East
Chorley East | Party | Candidate | Votes | % | ±% |
| | Labour | Don Yates | 3,542 | 66.24 | |
| | Conservative | Roger Livesey | 1,805 | 33.76 | |
| Majority | 1,737 | 32.48 | |
| Turnout | 5,347 | 54.67 | |
| | Labour win (new seat) |
Chorley North
Chorley North | Party | Candidate | Votes | % | ±% |
| | Conservative | Mark Perks | 3,279 | 43.02 | |
| | Labour | Sharon Woodruff-Gray | 2,752 | 36.11 | |
| | Liberal Democrats | Glenda Charlesworth | 1,591 | 20.87 | |
| Majority | 527 | 6.91 | |
| Turnout | 7,622 | 65.77 | |
| | Conservative win (new seat) |
Chorley Rural East
Chorley Rural East | Party | Candidate | Votes | % | ±% |
| | Conservative | Mary Case | 3,826 | 46.47 | |
| | Labour | Thomas Robinson | 3,372 | 40.96 | |
| | Green | Matthew Sims | 1,035 | 12.57 | |
| Majority | 454 | 5.51 | |
| Turnout | 8,233 | 67.57 | |
| | Conservative win (new seat) |
Chorley Rural North
Chorley Rural North | Party | Candidate | Votes | % | ±% |
| | Conservative | Margaret Livesey | 2,442 | 40.82 | |
| | Labour | James Freeman | 2,160 | 36.11 | |
| | Liberal Democrats | Stephen Fenn | 1,380 | 23.07 | |
| Majority | 282 | 4.71 | |
| Turnout | 5,982 | 57.85 | |
| | Conservative win (new seat) |
Chorley Rural West
Chorley Rural West | Party | Candidate | Votes | % | ±% |
| | Labour | Alan Whittaker | 3,840 | 50.05 | |
| | Conservative | Keith Iddon | 3,833 | 49.95 | |
| Majority | 7 | 0.10 | |
| Turnout | 7,673 | 67.98 | |
| | Labour win (new seat) |
Chorley South
Chorley South | Party | Candidate | Votes | % | ±% |
| | Labour | Peter Wilson | 2,972 | 53.44 | |
| | Conservative | Lawrence Catterall | 1,602 | 28.80 | |
| | Liberal Democrats | David Porter | 988 | 17.76 | |
| Majority | 1,370 | 24.64 | |
| Turnout | 5,562 | 56.20 | |
| | Labour win (new seat) |
Chorley West
Chorley West | Party | Candidate | Votes | % | ±% |
| | Labour | Edward Forshaw | 3,369 | 40.26 | |
| | Conservative | Harold Heaton | 2,770 | 33.11 | |
| | Liberal Democrats | Kenneth Ball | 2,228 | 26.63 | |
| Majority | 599 | 7.15 | |
| Turnout | 8,367 | 63.64 | |
| | Labour win (new seat) |
Fylde
Fylde East
Fylde East | Party | Candidate | Votes | % | ±% |
| | Independent | Elizabeth Oades | 2,309 | 37.02 | |
| | Conservative | Peter Sowden | 2,051 | 32.89 | |
| | Labour | Adrian Hutton | 1,207 | 19.35 | |
| | Liberal Democrats | Willian Winlow | 670 | 10.74 | |
| Majority | 258 | 4.13 | |
| Turnout | 6,237 | 60.67 | |
| | Independent win (new seat) |
Fylde South
Fylde South | Party | Candidate | Votes | % | ±% |
| | Conservative | Bernard Whittle | 2,954 | 54.45 | |
| | Labour | Michelle Miles | 1,430 | 26.36 | |
| | Liberal Democrats | Patricia Fielding | 1,041 | 19.19 | |
| Majority | 1,524 | 28.09 | |
| Turnout | 6,233 | 60.46 | |
| | Conservative win (new seat) |
Fylde West
Fylde West | Party | Candidate | Votes | % | ±% |
| | Conservative | Joyce Stuart | 3,426 | 54.97 | |
| | Labour | Nicholas Wareing | 1,534 | 24.61 | |
| | Liberal Democrats | John Graddon | 1,273 | 20.42 | |
| Majority | 1,892 | 30.36 | |
| Turnout | 6,233 | 63.30 | |
| | Conservative win (new seat) |
Lytham
Burnley Central East | Party | Candidate | Votes | % | ±% |
| | Conservative | Timothy Ashton | 3,647 | 59.31 | |
| | Labour | Marjorie Sherwood | 1,437 | 23.37 | |
| | Liberal Democrats | Michael Turner | 1,065 | 17.32 | |
| Majority | 2,210 | 35.94 | |
| Turnout | 6,149 | 61.24 | |
| | Conservative win (new seat) |
St Annes North
St Annes North | Party | Candidate | Votes | % | ±% |
| | Conservative | Colin Walton | 2,640 | 41.89 | |
| | Liberal Democrats | Howard Henshaw | 2,152 | 34.15 | |
| | Labour | William Taylor | 1,510 | 23.96 | |
| Majority | 488 | 7.74 | |
| Turnout | 6,302 | 59.98 | |
| | Conservative win (new seat) |
St Annes South
St Annes South | Party | Candidate | Votes | % | ±% |
| | Conservative | Alfred Jealous | 2,601 | 42.77 | |
| | Liberal Democrats | Karen Henshaw | 2,096 | 34.47 | |
| | Labour | Dennis Davenport | 1,384 | 22.76 | |
| Majority | 505 | 8.30 | |
| Turnout | 6,081 | 56.62 | |
| | Conservative win (new seat) |
Accrington North
Accrington North | Party | Candidate | Votes | % | ±% |
| | Labour | Jean Battle | 3,561 | 60.52 | |
| | Conservative | Janet Storey | 2,323 | 39.48 | |
| Majority | 1,238 | 21.04 | |
| Turnout | 5,884 | 61.06 | |
| | Labour win (new seat) |
Accrington South
Accrington South | Party | Candidate | Votes | % | ±% |
| | Labour | Wendy Dwyer | 3,288 | 58.80 | |
| | Conservative | Paul Barton | 2,394 | 41.20 | |
| Majority | 984 | 17.60 | |
| Turnout | 5,592 | 59.06 | |
| | Labour win (new seat) |
Accrington West
Accrington West | Party | Candidate | Votes | % | ±% |
| | Labour | Doreen Pollitt | 3,201 | 61.81 | |
| | Conservative | Mohammed Siddique | 1,978 | 38.19 | |
| Majority | 1,223 | 23.62 | |
| Turnout | 5,179 | 52.27 | |
| | Labour win (new seat) |
Great Harwood
Great Harwood | Party | Candidate | Votes | % | ±% |
| | Labour | Susan Shorrock | 2,241 | 43.56 | |
| | Conservative | Winifred Frankland | 2,086 | 40.54 | |
| | Liberal Democrats | George Slynn | 818 | 15.90 | |
| Majority | 155 | 3.02 | |
| Turnout | 5,145 | 62.52 | |
| | Labour win (new seat) |
Oswaldtwistle
Oswaldtwistle | Party | Candidate | Votes | % | ±% |
| | Labour | Dorothy Westell | 2,918 | 46.24 | |
| | Conservative | Peter Britcliffe | 2,244 | 35.56 | |
| | Liberal Democrats | Clive Fisher | 1,149 | 18.20 | |
| Majority | 674 | 10.68 | |
| Turnout | 6,311 | 60.71 | |
| | Labour win (new seat) |
Rishton and Clayton-le-Moors
Rishton and Clayton-le-Moors | Party | Candidate | Votes | % | ±% |
| | Labour | Miles Parkinson | 2,958 | 45.74 | |
| | Conservative | Ann Scaife | 2,539 | 39.26 | |
| | Liberal Democrats | William Greene | 970 | 15.00 | |
| Majority | 419 | 6.48 | |
| Turnout | 6,467 | 61.29 | |
| | Labour win (new seat) |
Heysham
Heysham | Party | Candidate | Votes | % | ±% |
| | Labour | Jean Yates | 2,453 | 39.30 | |
| | Conservative | Kenneth Brown | 2,214 | 35.48 | |
| | Liberal Democrats | William Riley | 792 | 12.69 | |
| | Independent | Michael Greenall | 607 | 9.73 | |
| | Green | Stephen Dickenson | 175 | 2.80 | |
| Majority | 239 | 3.82 | |
| Turnout | 6,241 | 59.32 | |
| | Labour win (new seat) |
Lancaster Central
Lancaster Central | Party | Candidate | Votes | % | ±% |
| | Green | Christopher Coates | 2,252 | 31.43 | |
| | Labour | Michael Gibson | 2,102 | 29.33 | |
| | Conservative | Helen Helme | 1,821 | 25.41 | |
| | Liberal Democrats | Catherine Fritz | 991 | 13.83 | |
| Majority | 150 | 2.10 | |
| Turnout | 7,166 | 63.67 | |
| | Green win (new seat) |
Lancaster East
Lancaster East | Party | Candidate | Votes | % | ±% |
| | Labour | Elizabeth Scott | 2,240 | 41.60 | |
| | Green | Matthew Wottoon | 1,482 | 27.52 | |
| | Liberal Democrats | Philip Dunster | 882 | 16.38 | |
| | Conservative | Joan Jackson | 781 | 14.50 | |
| Majority | 758 | 14.08 | |
| Turnout | 5,385 | 56.30 | |
| | Labour win (new seat) |
Lancaster Rural East
Lancaster Rural East | Party | Candidate | Votes | % | ±% |
| | Conservative | Susan Charles | 3,947 | 44.55 | |
| | Liberal Democrats | Joyce Pritchard | 2,560 | 28.89 | |
| | Labour | Benjamin Soffa | 1,768 | 19.95 | |
| | Green | Abigail Mills | 585 | 6.60 | |
| Majority | 1,387 | 15.66 | |
| Turnout | 8,860 | 68.75 | |
| | Conservative win (new seat) |
Lancaster Rural North
Lancaster Rural North | Party | Candidate | Votes | % | ±% |
| | Conservative | Sarah Fishwick | 2,518 | 36.32 | |
| | Labour | Janette Gardner | 1,902 | 27.43 | |
| | Liberal Democrats | June Greenwell | 1,396 | 20.14 | |
| | Independent | Keith Budden | 781 | 11.26 | |
| | Green | Ian McCulloch | 336 | 4.85 | |
| Majority | 616 | 8.89 | |
| Turnout | 6,933 | 65.87 | |
| | Conservative win (new seat) |
Lancaster South East
Lancaster South East | Party | Candidate | Votes | % | ±% |
| | Labour | Peter Elliott | 1,862 | 37.23 | |
| | Conservative | Clare Hilley | 1,370 | 27.39 | |
| | Liberal Democrats | Robert Hayes | 1,370 | 27.39 | |
| | Green | Susanna Holden | 395 | 7.90 | |
| Majority | 448 | 9.76 | |
| Turnout | 5,001 | 52.28 | |
| | Labour win (new seat) |
Morecambe North
Morecambe North | Party | Candidate | Votes | % | ±% |
| | Conservative | Anthony Jones | 2,667 | 44.85 | |
| | Labour | Elaine Bush | 1,840 | 30.94 | |
| | Liberal Democrats | Ian Clift | 1,089 | 18.31 | |
| | Green | Pamela White | 351 | 5.90 | |
| Majority | 827 | 13.91 | |
| Turnout | 5,947 | 73.19 | |
| | Conservative win (new seat) |
Morecambe South
Morecambe South | Party | Candidate | Votes | % | ±% |
| | Labour | Albert Thornton | 2,554 | 38.64 | |
| | Liberal Democrats | Ronald Day | 1,927 | 29.15 | |
| | Conservative | Gordon Hagel | 1,898 | 28.71 | |
| | Green | Howard Jago | 231 | 3.49 | |
| Majority | 627 | 9.49 | |
| Turnout | 6,610 | 60.89 | |
| | Labour win (new seat) |
Morecambe West
Morecambe West | Party | Candidate | Votes | % | ±% |
| | Labour | Janice Hanson | 2,904 | 53.32 | |
| | Conservative | John Mace | 1,331 | 24.44 | |
| | Liberal Democrats | Michael Gradwell | 983 | 18.05 | |
| | Green | Mark Westcombe | 228 | 4.19 | |
| Majority | 1,573 | 28.88 | |
| Turnout | 5,446 | 51.02 | |
| | Labour win (new seat) |
Skerton
Skerton | Party | Candidate | Votes | % | ±% |
| | Labour | Nicola Penney | 3,096 | 59.93 | |
| | Conservative | Anthony Johnson | 1,347 | 26.07 | |
| | Green | Ashley Toms | 723 | 14.00 | |
| Majority | 1,749 | 33.86 | |
| Turnout | 5,166 | 54.16 | |
| | Labour win (new seat) |
Brierfield and Nelson North
Brierfield and Nelson North | Party | Candidate | Votes | % | ±% |
| | Liberal Democrats | Nawaz Ahmed | 2,913 | 45.70 | |
| | Labour | Colin Waite | 2,135 | 33.50 | |
| | Conservative | Tonia Barton | 876 | 13.74 | |
| | BNP | Anthony Locke | 450 | 7.06 | |
| Majority | 778 | 12.20 | |
| Turnout | 6,374 | 61.78 | |
| | Liberal Democrats win (new seat) |
Nelson South
Nelson South | Party | Candidate | Votes | % | ±% |
| | Liberal Democrats | Sonia Robinson | 2,133 | 35.73 | |
| | Labour | Dorothy Ormrod | 2,081 | 34.86 | |
| | Conservative | Ann Jackson | 1,025 | 17.17 | |
| | BNP | Trevor Dawson | 731 | 12.24 | |
| Majority | 52 | 0.87 | |
| Turnout | 5,970 | 59.91 | |
| | Liberal Democrats win (new seat) |
Pendle Central
Pendle Central | Party | Candidate | Votes | % | ±% |
| | Labour | Leonard Ormrod | 2,239 | 37.99 | |
| | Liberal Democrats | Dorothy Lord | 1,716 | 29.11 | |
| | Conservative | Michael Landriau | 1,124 | 19.07 | |
| | BNP | Brian Parker | 815 | 13.83 | |
| Majority | 523 | 8.88 | |
| Turnout | 5,894 | 57.79 | |
| | Labour win (new seat) |
Pendle East
Pendle East | Party | Candidate | Votes | % | ±% |
| | Conservative | Michael Calvert | 2,539 | 36.13 | |
| | Liberal Democrats | Alan Davies | 2,197 | 31.27 | |
| | Labour | Frank Allanson | 1,549 | 22.04 | |
| | BNP | Thomas Boocock | 742 | 10.56 | |
| Majority | 342 | 4.86 | |
| Turnout | 7,027 | 66.20 | |
| | Conservative win (new seat) |
Pendle West
Pendle West | Party | Candidate | Votes | % | ±% |
| | Conservative | Shelagh Derwent | 3,489 | 47.21 | |
| | Liberal Democrats | Francis Wren | 1,722 | 23.30 | |
| | Labour | Sheila Wicks | 1,591 | 21.53 | |
| | BNP | Robert Cottage | 588 | 7.96 | |
| Majority | 1,767 | 23.91 | |
| Turnout | 7,390 | 70.18 | |
| | Conservative win (new seat) |
West Craven
West Craven | Party | Candidate | Votes | % | ±% |
| | Liberal Democrats | David Whipp | 2,954 | 35.63 | |
| | Conservative | Morris Horsfield | 2,562 | 30.90 | |
| | Labour | Antony Holian | 1,849 | 22.30 | |
| | BNP | Geoffrey Whitehead | 678 | 8.18 | |
| | UKIP | Steven Preston | 248 | 2.99 | |
| Majority | 392 | 4.73 | |
| Turnout | 8,291 | 66.23 | |
| | Liberal Democrats win (new seat) |
Preston Central North
Preston Central North | Party | Candidate | Votes | % | ±% |
| | Labour | Francesco De Molfetta | 1,674 | 30.86 | |
| | Conservative | Constance McManus | 1,283 | 23.65 | |
| | Liberal Democrats | Samir Bohra | 987 | 18.20 | |
| | Independent | Terry Cartwright | 812 | 14.97 | |
| | Respect | Valli Umarji | 551 | 10.16 | |
| | Independent | John Wilson | 117 | 2.16 | |
| Majority | 391 | 7.21 | |
| Turnout | 5,424 | 60.06 | |
| | Labour win (new seat) |
Preston Central South
Preston Central South | Party | Candidate | Votes | % | ±% |
| | Labour | Vali Patel | 2,218 | 49.72 | |
| | Conservative | Ronald Smith | 944 | 21.16 | |
| | Liberal Democrats | Tracy Singleton | 878 | 19.68 | |
| | Respect | Steven Brooks | 421 | 9.44 | |
| Majority | 1,274 | 28.56 | |
| Turnout | 4,461 | 52.01 | |
| | Labour win (new seat) |
Preston City
Preston City | Party | Candidate | Votes | % | ±% |
| | Labour | Yakub Patel | 2,044 | 46.44 | |
| | Respect | Elaine Abbot | 887 | 20.16 | |
| | Liberal Democrats | Wilfred Gavin | 780 | 17.72 | |
| | Conservative | Collette Nuttall | 690 | 15.68 | |
| Majority | 1,157 | 26.28 | |
| Turnout | 4,401 | 54.95 | |
| | Labour win (new seat) |
Preston East
Preston East | Party | Candidate | Votes | % | ±% |
| | Labour | Kevin Ellard | 2,648 | 57.92 | |
| | Conservative | Raymond Johnson | 1,105 | 24.17 | |
| | Liberal Democrats | Lydia Livingston | 629 | 13.76 | |
| | Respect | Ronald Yates | 190 | 4.15 | |
| Majority | 1,543 | 33.75 | |
| Turnout | 4,572 | 47.86 | |
| | Labour win (new seat) |
Preston North
Preston North | Party | Candidate | Votes | % | ±% |
| | Conservative | Geoffrey Driver | 2,852 | 47.87 | |
| | Liberal Democrats | William Parkinson | 2,003 | 33.62 | |
| | Labour | Alan Woods | 1,103 | 18.51 | |
| Majority | 849 | 14.25 | |
| Turnout | 5,958 | 67.70 | |
| | Conservative win (new seat) |
Preston North East
Preston North East | Party | Candidate | Votes | % | ±% |
| | Conservative | Michael Welsh | 2,301 | 39.88 | |
| | Labour | William Burke | 1,772 | 30.71 | |
| | Liberal Democrats | Richard Hopkin | 1,697 | 29.41 | |
| Majority | 529 | 9.17 | |
| Turnout | 5,770 | 59.51 | |
| | Conservative win (new seat) |
Preston North West
Preston North West | Party | Candidate | Votes | % | ±% |
| | Labour | Thomas Burns | 2,085 | 44.55 | |
| | Liberal Democrats | Mark Jewell | 1,410 | 30.13 | |
| | Conservative | Julie Mullineaux | 1,089 | 23.27 | |
| | Respect | Edna Greenwood | 96 | 2.05 | |
| Majority | 675 | 14.42 | |
| Turnout | 4,680 | 57.59 | |
| | Labour win (new seat) |
Preston Rural
Preston Rural | Party | Candidate | Votes | % | ±% |
| | Conservative | George Wilkins | 3,538 | 63.47 | |
| | Liberal Democrats | Rowena Edmondson | 1,126 | 20.20 | |
| | Labour | Pauline Jackson | 910 | 16.33 | |
| Majority | 2,412 | 43.27 | |
| Turnout | 5,574 | 66.71 | |
| | Conservative win (new seat) |
Preston South East
Preston South East | Party | Candidate | Votes | % | ±% |
| | Labour | Dorothy Mein | 1,849 | 52.55 | |
| | Respect | Sumera Rizwan | 650 | 18.47 | |
| | Liberal Democrats | Paul Valentine | 516 | 14.66 | |
| | Conservative | Hussain Mulla | 504 | 14.32 | |
| Majority | 1,199 | 34.08 | |
| Turnout | 3,519 | 50.08 | |
| | Labour win (new seat) |
Preston West
Preston West | Party | Candidate | Votes | % | ±% |
| | Liberal Democrats | Norman Abram | 2,411 | 45.06 | |
| | Labour | Paul Jackson | 1,471 | 27.49 | |
| | Conservative | Susan Hudson | 1,469 | 27.45 | |
| Majority | 940 | 17.57 | |
| Turnout | 5,351 | 56.69 | |
| | Liberal Democrats win (new seat) |
Clitheroe
Clitheroe | Party | Candidate | Votes | % | ±% |
| | Liberal Democrats | John Sutcliffe | 2,935 | 41.73 | |
| | Conservative | Sheila Sims | 2,552 | 36.29 | |
| | Labour | Giles Bridge | 1,546 | 21.98 | |
| Majority | 383 | 5.44 | |
| Turnout | 7,033 | 61.21 | |
| | Liberal Democrats win (new seat) |
Longridge with Bowland
Longridge with Bowland | Party | Candidate | Votes | % | ±% |
| | Conservative | Mary Wilson | | | |
| | Liberal Democrats | Jeffrey Flitcroft | 1,961 | 28.41 | |
| | Labour | Brenda Lambert | 1,088 | 15.76 | |
| Majority | 1,893 | 27.42 | |
| Turnout | 6,903 | 65.21 | |
| | Conservative win (new seat) |
Ribble Valley North East
Ribble Valley North East | Party | Candidate | Votes | % | ±% |
| | Conservative | Albert Atkinson | 4,661 | 56.55 | |
| | Liberal Democrats | Margaret Sutcliffe | 2,258 | 27.39 | |
| | Labour | Laura Field | 1,324 | 16.06 | |
| Majority | 2,403 | 29.16 | |
| Turnout | 8,243 | 71.70 | |
| | Conservative win (new seat) |
Ribble Valley South West
Ribble Valley South West | Party | Candidate | Votes | % | ±% |
| | Conservative | Christopher Holtom | 4,212 | 58.96 | |
| | Liberal Democrats | Graham Sowter | 1,731 | 24.23 | |
| | Labour | David Hinder | 1,201 | 16.81 | |
| Majority | 2,481 | 34.73 | |
| Turnout | 7,144 | 69.39 | |
| | Conservative win (new seat) |
Rossendale East
Rossendale East | Party | Candidate | Votes | % | ±% |
| | Conservative | James Eaton | 2,828 | 41.65 | |
| | Labour | David Hancock | 2,661 | 39.20 | |
| | Liberal Democrats | John Glendinning | 1,300 | 19.15 | |
| Majority | 167 | 2.45 | |
| Turnout | 6,789 | 59.63 | |
| | Conservative win (new seat) |
Rossendale North
Rossendale North | Party | Candidate | Votes | % | ±% |
| | Labour | Hazel Harding | 2,899 | 44.37 | |
| | Conservative | Anthony Winder | 2,856 | 43.71 | |
| | Liberal Democrats | Tariq Mahmood | 779 | 11.92 | |
| Majority | 43 | 0.66 | |
| Turnout | 6,534 | 64.77 | |
| | Labour win (new seat) |
Rossendale South
Rossendale South | Party | Candidate | Votes | % | ±% |
| | Conservative | Duncan Ruddick | 2,627 | 37.30 | |
| | Labour | Alyson Barnes | 2,593 | 36.82 | |
| | Liberal Democrats | James Pilling | 1,490 | 21.15 | |
| | Green | Linda Hemsley | 333 | 4.73 | |
| Majority | 34 | 0.48 | |
| Turnout | 7,043 | 62.99 | |
| | Conservative win (new seat) |
Rossendale West
Rossendale West | Party | Candidate | Votes | % | ±% |
| | Labour | Robert Wilkinson | 2,615 | 50.55 | |
| | Conservative | Peter Evans | 2,558 | 49.45 | |
| Majority | 57 | 1.10 | |
| Turnout | 5,173 | 59.57 | |
| | Labour win (new seat) |
Whitworth
Whitworth | Party | Candidate | Votes | % | ±% |
| | Labour | Sean Serridge | 1,837 | 34.41 | |
| | Conservative | Lynda Barnes | 1,528 | 28.63 | |
| | Independent | Ronald Neal | 1,238 | 23.19 | |
| | Liberal Democrats | Reginald Lane | 735 | 13.77 | |
| Majority | 309 | 5.78 | |
| Turnout | 5,338 | 57.28 | |
| | Labour win (new seat) |
Bamber Bridge and Walton-le-Dale
Bamber Bridge and Walton-le-Dale | Party | Candidate | Votes | % | ±% |
| | Labour | Graham Davies | 2,321 | 42.19 | |
| | Conservative | Carol Chisholm | 1,720 | 31.27 | |
| | Idle Toad | John Higgins | 741 | 13.47 | |
| | Liberal Democrats | Anthony Hartley | 719 | 13.07 | |
| Majority | 601 | 10.92 | |
| Turnout | 5,501 | 58.37 | |
| | Labour win (new seat) |
Faringdon
Faringdon | Party | Candidate | Votes | % | ±% |
| | Labour | Fred Heyworth | 2,144 | 41.03 | |
| | Conservative | Kathleen Beattie | 1,613 | 30.86 | |
| | Liberal Democrats | Christine Harrison | 1,469 | 28.11 | |
| Majority | 531 | 10.17 | |
| Turnout | 5,226 | 60.10 | |
| | Labour win (new seat) |
Leyland Central
Leyland Central | Party | Candidate | Votes | % | ±% |
| | Labour | Matthew Tomlinson | 3,441 | 47.82 | |
| | Liberal Democrats | Mark Alcock | 2,134 | 29.66 | |
| | Conservative | John Otter | 1,620 | 22.52 | |
| Majority | 1,307 | 18.16 | |
| Turnout | 7,195 | 62.79 | |
| | Labour win (new seat) |
Leyland South West
Leyland South West | Party | Candidate | Votes | % | ±% |
| | Labour | Anne Brown | 3,402 | 51.35 | |
| | Conservative | Michael Green | 1,975 | 29.81 | |
| | Liberal Democrats | Wendy Alcock | 1,248 | 18.84 | |
| Majority | 1,427 | 21.54 | |
| Turnout | 6,625 | 57.42 | |
| | Labour win (new seat) |
Penwortham North
Penwortham North | Party | Candidate | Votes | % | ±% |
| | Liberal Democrats | Anthony Pimblett | 2,567 | 39.08 | |
| | Conservative | Mary Robinson | 2,176 | 33.13 | |
| | Labour | Diane Maier | 1,288 | 19.61 | |
| | Independent | David Bennett | 537 | 8.18 | |
| Majority | 391 | 5.95 | |
| Turnout | 6,568 | 70.00 | |
| | Liberal Democrats win (new seat) |
Penwortham South
Penwortham South | Party | Candidate | Votes | % | ±% |
| | Labour | Howard Gore | 3,239 | 47.44 | |
| | Conservative | Dorothy Gardner | 2,316 | 33.93 | |
| | Liberal Democrats | Andrew Jones | 1,272 | 18.63 | |
| Majority | 923 | 13.51 | |
| Turnout | 6,827 | 60.30 | |
| | Labour win (new seat) |
South Ribble Rural East
South Ribble Rural East | Party | Candidate | Votes | % | ±% |
| | Idle Toad | Thomas Sharratt | 2,619 | 44.29 | |
| | Labour | David Watts | 1,660 | 28.07 | |
| | Conservative | Philip Ames | 1,634 | 27.64 | |
| Majority | 959 | 16.22 | |
| Turnout | 5,913 | 60.52 | |
| | Idle Toad win (new seat) |
South Ribble Rural West
South Ribble Rural West | Party | Candidate | Votes | % | ±% |
| | Conservative | Keith Young | 4,169 | 53.89 | |
| | Labour | Andrew Bennison | 2,004 | 25.91 | |
| | Liberal Democrats | Nicholas Sumner | 1,563 | 20.20 | |
| Majority | 2,165 | 27.98 | |
| Turnout | 7,736 | 68.53 | |
| | Conservative win (new seat) |
Ormskirk West
Ormskirk West | Party | Candidate | Votes | % | ±% |
| | Labour | Francis Williams | 2,453 | 43.62 | |
| | Conservative | Valerie Hopley | 2,377 | 42.26 | |
| | Green | Maurice George | 496 | 8.82 | |
| | Independent | Kenneth Walters | 298 | 5.30 | |
| Majority | 76 | 1.36 | |
| Turnout | 5,624 | 60.58 | |
| | Labour win (new seat) |
Skelmersdale Central
Skelmersdale Central | Party | Candidate | Votes | % | ±% |
| | Labour | Terence Aldridge | 3,610 | 73.82 | |
| | Liberal Democrats | Alan Spears | 738 | 15.09 | |
| | Conservative | Doreen Stephenson | 542 | 11.08 | |
| Majority | 2,872 | 58.73 | |
| Turnout | 4,890 | 42.56 | |
| | Labour win (new seat) |
Skelmersdale East
Skelmersdale East | Party | Candidate | Votes | % | ±% |
| | Labour | Robert Pendleton | 3,862 | 60.40 | |
| | Conservative | Carolyn Evans | 2,532 | 39.60 | |
| Majority | 1,330 | 20.80 | |
| Turnout | 6,394 | 56.99 | |
| | Labour win (new seat) |
Skelmersdale West
Skelmersdale West | Party | Candidate | Votes | % | ±% |
| | Labour | Christopher Cheetham | 4,674 | 80.14 | |
| | Conservative | Adrian Owens | 1,158 | 19.86 | |
| Majority | 3,516 | 60.28 | |
| Turnout | 5,832 | 51.18 | |
| | Labour win (new seat) |
West Lancashire East
West Lancashire East | Party | Candidate | Votes | % | ±% |
| | Conservative | Richard Shepherd | 2,978 | 47.90 | |
| | Labour | Jacqueline Citarella | 1,958 | 31.49 | |
| | Liberal Democrats | Henry Reeves | 1,281 | 20.62 | |
| Majority | 1,020 | 16.41 | |
| Turnout | 6,217 | 60.71 | |
| | Conservative win (new seat) |
West Lancashire North
West Lancashire North | Party | Candidate | Votes | % | ±% |
| | Conservative | Malcolm Barron | 3,596 | 54.13 | |
| | Labour | David Lloyd | 1,533 | 23.08 | |
| | Liberal Democrats | Marion Hancock | 796 | 11.98 | |
| | Independent | Joan Draper | 718 | 10.81 | |
| Majority | 2,063 | 31.05 | |
| Turnout | 6,643 | 59.79 | |
| | Conservative win (new seat) |
West Lancashire South
West Lancashire South | Party | Candidate | Votes | % | ±% |
| | Conservative | David O'Toole | 4,041 | 56.22 | |
| | Labour | Paul Cotterill | 2,384 | 33.17 | |
| | Green | John Watt | 763 | 10.61 | |
| Majority | 1,657 | 23.05 | |
| Turnout | 7,188 | 63.49 | |
| | Conservative win (new seat) |
West Lancashire West
West Lancashire West | Party | Candidate | Votes | % | ±% |
| | Conservative | William Cropper | 3,700 | 51.81 | |
| | Labour | Cynthia Dereli | 3,441 | 48.19 | |
| Majority | 259 | 3.62 | |
| Turnout | 7,141 | 60.09 | |
| | Conservative win (new seat) |
Amounderness
Amounderness | Party | Candidate | Votes | % | ±% |
| | Conservative | John Shedwick | 3,316 | 57.42 | |
| | Labour | Alan Morgan | 2,459 | 42.58 | |
| Majority | 857 | 14.84 | |
| Turnout | 5,775 | 65.01 | |
| | Conservative win (new seat) |
Fleetwood East
Fleetwood East | Party | Candidate | Votes | % | ±% |
| | Labour | Clive Grunshaw | 3,092 | 57.65 | |
| | Conservative | Mark Hamer | 1,537 | 28.66 | |
| | Liberal Democrats | Kenneth Palmerton | 734 | 13.69 | |
| Majority | 1,555 | 28.99 | |
| Turnout | 5,363 | 50.69 | |
| | Labour win (new seat) |
Fleetwood West
Fleetwood West | Party | Candidate | Votes | % | ±% |
| | Labour | Vincent Riley | 2,621 | 51.04 | |
| | Conservative | William Proctor | 1,647 | 32.08 | |
| | Liberal Democrats | Jonathon Bamborough | 567 | 11.04 | |
| | UKIP | Gerard Gerrard | 300 | 5.84 | |
| Majority | 974 | 18.96 | |
| Turnout | 5,135 | 54.89 | |
| | Labour win (new seat) |
Garstang
Garstang | Party | Candidate | Votes | % | ±% |
| | Conservative | Valerie Wilson | 4,355 | 53.74 | |
| | Liberal Democrats | Jack Rogers | 1,968 | 24.28 | |
| | Labour | Marilyn Levey | 1,781 | 21.98 | |
| Majority | 2,387 | 29.46 | |
| Turnout | 8,104 | 67.32 | |
| | Conservative win (new seat) |
Poulton-le-Fylde
Poulton-le-Fylde | Party | Candidate | Votes | % | ±% |
| | Conservative | Geoffrey Roper | 3,753 | 53.40 | |
| | Labour | Alphonse Robert | 2,211 | 31.46 | |
| | Liberal Democrats | Kevan Benfold | 1,064 | 15.14 | |
| Majority | 1,542 | 21.94 | |
| Turnout | 7,028 | 63.99 | |
| | Conservative win (new seat) |
Thornton Cleveleys Central
Thornton Cleveleys Central | Party | Candidate | Votes | % | ±% |
| | Conservative | Keith Tebbs | 2,709 | 40.64 | |
| | Labour | Geoffrey Horrocks | 2,368 | 35.52 | |
| | Liberal Democrats | Steven Bate | 1,197 | 17.96 | |
| | UKIP | Roy Hopwood | 392 | 5.88 | |
| Majority | 341 | 5.12 | |
| Turnout | 6,666 | 59.83 | |
| | Conservative win (new seat) |
Thornton Cleveleys North
Thornton Cleveleys North | Party | Candidate | Votes | % | ±% |
| | Labour | Penelope Martin | 643 | 50.45 | |
| | Conservative | Arthur Brooks | 2,297 | 39.41 | |
| | UKIP | Henry Wilkinson | 591 | 10.14 | |
| Majority | 643 | 11.04 | |
| Turnout | 5,828 | 58.86 | |
| | Labour win (new seat) |
Wyreside
Wyreside | Party | Candidate | Votes | % | ±% |
| | Conservative | Robert Mutch | 5,048 | 64.22 | |
| | Labour | Margaret Jackson | 2,812 | 35.78 | |
| Majority | 2,236 | 28.44 | |
| Turnout | 7,860 | 63.67 | |
| | Conservative win (new seat) |
Notes


 Council elections in Lancashire


