English local authority election
2005 Essex County Council election
|
|
All 75 seats to Essex County Council
38 seats needed for a majority |
|---|
| | First party | Second party | Third party | | |  | | | | Leader | Paul White | Paul Sztumpf | Kenneth Jones | | Party | Conservative | Labour | Liberal Democrats | | Leader since | >1998 | June 2001 | May 1997 | | Leader's seat | Stock | Harlow North | Park | | Last election | 49 seats, 41.7% | 19 seats, 30.6% | 10 seats, 24.3% | | Seats before | 48 | 18 | 11 | | Seats won | 52 | 13 | 8 | | Seat change |  4 4 |  5 5 | 3 | | Popular vote | 285,899 | 156,561 | 147,561 | | Percentage | 44.5% | 24.3% | 22.9% | | Swing | 2.8% | 6.3% | 1.4% |
| | | Fourth party | Fifth party | Sixth party | | | | | | | Leader | Roy Smith | David Linnell | N/a | | Party | Community Representative | Loughton Residents | Green | | Leader since | 2002[1] | June 2001 | N/a | | Leader's seat | Clacton West | Loughton St Marys (Retiring) | N/a | | Last election | 0 seats, 0.6% | 1 seats, 0.4% | 0 seats, 1.9% | | Seats before | 1 | 1 | 0 | | Seats won | 1 | 1 | 0 | | Seat change | 1 |  | | | Popular vote | 6,003 | 2,734 | 35,696 | | Percentage | 0.9% | 0.4% | 5.6% | | Swing | 0.3% | | 3.7% | |
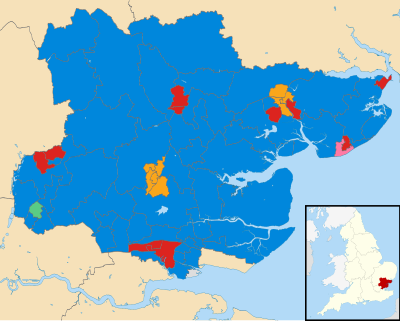 Results by electoral division.Conservatives in blue, Labour in red, Liberal Democrats in yellow, Community Representatives Party in pink and Loughton Residents Association in green. |
Majority party before election
Conservative
| Majority party after election
Conservative
| |
An election to Essex County Council took place on 9 May 2005 as part of the 2005 United Kingdom local elections. 75 councillors were elected from various electoral divisions, which returned either one or two county councillors each by first-past-the-post voting for a four-year term of office. The electoral divisions were redrawn for this election.
The Conservative Party retained control with an increased majority, winning 52 of the 75 seats. Labour and the Liberal Democrats both lost seats.
Previous composition
2001 election
| Party | Seats |
| | Conservative | 49 |
| | Labour | 19 |
| | Liberal Democrats | 10 |
| | Loughton Residents | 1 |
| Total | 79 |
Composition of council seats before election
| Party | Seats |
| | Conservative | 48 |
| | Labour | 18 |
| | Liberal Democrats | 11 |
| | Loughton Residents | 1 |
| | Community Representative | 1 |
| Total | 79 |
Results
Essex County Council election, 2005[2][3] | Party | Seats | Gains | Losses | Net gain/loss | Seats % | Votes % | Votes | +/− |
| | Conservative | 52 | | | 4 | | 44.5 | 285,899 | +2.8 |
| | Labour | 13 | | | 5 | | 24.3 | 156,561 | −6.3 |
| | Liberal Democrats | 8 | | | 3 | | 22.9 | 147,561 | +1.4 |
| | Community Representative | 1 | | | 1 | | 0.9 | 6,003 | +0.3 |
| | Loughton Residents | 1 | | | | | 0.4 | 2,734 | |
| | Green | 0 | | | | | 5.6 | 35,696 | +3.7 |
| | UKIP | 0 | | | | | 0.6 | 4,112 | N/A |
| | Independent | 0 | | | | | 0.3 | 2,070 | −0.3 |
| | BNP | 0 | | | | | 0.2 | 1,391 | N/A |
| | English Democrat | 0 | | | | | 0.1 | 825 | N/A |
| | Veritas | 0 | | | | | >0.1 | 158 | N/A |
| Total | 75 | | | |
Election of Group Leaders
Paul White (Stock) was re elected leader of the Conservative Group, Tom Smith-Hughes (Chelmsford North) was elected leader of the Liberal Democratic Group and Paul Kirkman (Pitsea) was elected leader of the Labour Group.
Election of Leader of the Council
Paul White the leader of the conservative group was duly elected leader of the council and formed a conservative administration.
Results by District
Basildon
District summary
| Party | Seats | +/- | Votes | % | +/- |
| | Conservative | 5 | | 57,459 | 45.8 | +2.8 |
| | Labour | 4 | 1 | 39,537 | 31.5 | −7.8 |
| | Liberal Democrat | 0 | | 22,787 | 18.2 | +0.8 |
| | Green | 0 | | 5,101 | 4.1 | +4.1 |
| | English Democrats | 0 | | 457 | 0.4 | +0.4 |
Division results
Basildon Westley Heights | Party | Candidate | Votes | % | ±% |
| | Conservative | John Schofield | 3,654 | 37.9 | −3.6 |
| | Liberal Democrats | Geoffrey Williams * | 2,753 | 28.6 | +7.8 |
| | Labour | Swatantra Nadanwar * | 2,489 | 25.8 | −11.9 |
| | English Democrat | Kim Gandy | 457 | 4.7 | New |
| | Green | Ernest Humphries | 283 | 2.9 | New |
| Majority | 901 | 9.3 | +5.5 |
| Turnout | 9,636 | 62.9 | +2.0 |
| | Conservative hold | Swing | −5.7 | |
Between 2001 and 2005, the seat was won by the Liberal Democrats candidate in a by-election, however it is shown as a hold as it is compared to the previous full council election.
Billericay and Burstead | Party | Candidate | Votes | % |
| | Conservative | Anthony Headley * | 10,933 | 65.8 |
| | Conservative | Kay Twitchen * | 8,418 | 50.6 |
| | Liberal Democrats | Gilda Bellard | 3,868 | 23.3 |
| | Liberal Democrats | Geoffrey Raylor | 3,718 | 22.4 |
| | Labour | Patricia Reid | 2,674 | 16.1 |
| | Labour | Margaret Viney | 2,369 | 14.3 |
| | Green | Annie Humphries | 1,269 | 7.6 |
| Turnout | 18,490 | 69.7 |
| | Conservative win (new seat) |
| | Conservative win (new seat) |
Laindon Park and Fryerns | Party | Candidate | Votes | % |
| | Labour | William Archibald * | 6,707 | 54.3 |
| | Labour | Rachel Liebeschuetz * | 5,349 | 43.3 |
| | Conservative | Terry Fleet | 4,107 | 33.3 |
| | Conservative | Terri Sargent | 3,904 | 31.6 |
| | Liberal Democrats | Linda Williams | 1,903 | 15.4 |
| | Liberal Democrats | Jonathan Myall | 1,539 | 12.5 |
| | Green | Adam Ellis | 1,177 | 9.5 |
| Turnout | 12,343 | 55.7 |
| | Labour win (new seat) |
| | Labour win (new seat) |
Pitsea | Party | Candidate | Votes | % |
| | Labour | Keith Bobbin * | 6,968 | 50.3 |
| | Labour | Paul Kirkman * | 6,181 | 44.6 |
| | Conservative | David Abrahall | 4,910 | 35.4 |
| | Conservative | Andrew Baggott | 4,271 | 30.8 |
| | Liberal Democrats | Martin Howard | 2,229 | 16.1 |
| | Liberal Democrats | Philip Jenkins | 1,964 | 14.2 |
| | Green | David Wilkinson | 1,189 | 8.6 |
| Turnout | 13,856 | 51.2 |
| | Labour win (new seat) |
| | Labour win (new seat) |
Wickford Crouch | Party | Candidate | Votes | % |
| | Conservative | Don Morris * | 8,841 | 56.9 |
| | Conservative | Iris Pummell * | 8,421 | 54.2 |
| | Labour | Wendy Aitken | 3,927 | 25.3 |
| | Labour | Christopher Wilson | 3,873 | 24.9 |
| | Liberal Democrats | Vivien Howard | 2,444 | 15.7 |
| | Liberal Democrats | Michael Woods | 2,369 | 15.3 |
| | Green | Dean Hall | 1,183 | 7.6 |
| Turnout | 15,529 | 62.3 |
| | Conservative win (new seat) |
| | Conservative win (new seat) |
Braintree
District summary
| Party | Seats | +/- | Votes | % | +/- |
| | Conservative | 6 | | 29,212 | 43.2 | +3.1 |
| | Labour | 2 | 1 | 20,732 | 30.7 | −5.1 |
| | Liberal Democrat | 0 | | 11,808 | 17.5 | +0.2 |
| | Green | 0 | | 4,613 | 6.8 | |
| | UKIP | 0 | | 1,256 | 1.9 | +1.9 |
Division results
Bocking | Party | Candidate | Votes | % | ±% |
| | Labour | Lynn Watson | 3,231 | 40.1 | +0.5 |
| | Conservative | Jean Schmitt | 3,010 | 37.4 | −3.7 |
| | Liberal Democrats | Terrence Brooks | 1,362 | 16.9 | +4.1 |
| | Green | Wendy Partridge | 449 | 5.6 | −0.8 |
| Majority | 221 | 2.7 | |
| Turnout | 8,052 | 61.7 | −3.0 |
| | Labour gain from Conservative | Swing | +2.1 | |
Braintree Eastern | Party | Candidate | Votes | % |
| | Conservative | Nigel Edey * | 3,688 | 43.0 |
| | Labour | Eileen Davidson | 2,878 | 33.6 |
| | Liberal Democrats | Peter Braley | 1,251 | 14.6 |
| | Green | Duncan Stewart | 414 | 4.8 |
| | UKIP | Barbara Coutts | 338 | 3.9 |
| Majority | 810 | 9.5 |
| Turnout | 8,569 | 69.0 |
| | Conservative win (new seat) |
Braintree Town | Party | Candidate | Votes | % |
| | Labour | Elwyn Bishop | 2,700 | 35.9 |
| | Conservative | Graham Butland | 2,485 | 33.1 |
| | Liberal Democrats | Douglas Rice | 1,730 | 23.0 |
| | Green | Philip Hughes | 327 | 4.4 |
| | UKIP | Heather Sheehan | 273 | 3.6 |
| Majority | 215 | 2.9 |
| Turnout | 7,515 | 60.9 |
| | Labour win (new seat) |
Halstead | Party | Candidate | Votes | % | ±% |
| | Conservative | Joseph Pike * | 4,378 | 47.0 | +2.7 |
| | Labour | Moia Thorogood | 2,486 | 26.7 | −6.4 |
| | Liberal Democrats | Christine Bayley | 1,887 | 20.3 | +2.0 |
| | Green | Nelson Brunton | 560 | 6.0 | +1.7 |
| Majority | 1,892 | 20.3 | +9.1 |
| Turnout | 9,311 | 63.8 | +1.5 |
| | Conservative hold | Swing | +4.6 | |
Hedingham | Party | Candidate | Votes | % | ±% |
| | Conservative | David Finch * | 4,959 | 52.5 | +4.8 |
| | Liberal Democrats | Stephen Bolter | 2,182 | 23.1 | +0.8 |
| | Labour | John Kotz | 1,722 | 18.2 | −7.1 |
| | Green | Robert Kenney | 590 | 6.2 | +1.4 |
| Majority | 2,777 | 29.4 | +7.0 |
| Turnout | 9,453 | 69.4 | +4.0 |
| | Conservative hold | Swing | +2.0 | |
Three Fields with Great Notley | Party | Candidate | Votes | % |
| | Conservative | Roger Walters * | 4,045 | 51.9 |
| | Labour | William Edwards | 1,682 | 21.6 |
| | Liberal Democrats | Lesley Beckett | 1,475 | 18.9 |
| | Green | Kevin Peterson | 316 | 4.1 |
| | UKIP | Michael Baker | 278 | 3.6 |
| Majority | 2,363 | 30.3 |
| Turnout | 7,796 | 70.0 |
| | Conservative win (new seat) |
Witham Northern | Party | Candidate | Votes | % | ±% |
| | Conservative | Michael Lager | 3,108 | 37.8 | +8.7 |
| | Labour | Phillip Barlow * | 2,878 | 35.0 | −7.0 |
| | Green | James Abbott | 1,376 | 16.7 | −0.2 |
| | Liberal Democrats | Martin Ashby | 490 | 6.0 | −6.0 |
| | UKIP | Bryan Smith | 367 | 4.5 | New |
| Majority | 230 | 2.6 | |
| Turnout | 8,883 | 65.3 | +4.1 |
| | Conservative gain from Labour | Swing | +7.9 | |
Witham Southern | Party | Candidate | Votes | % | ±% |
| | Conservative | Derrick Louis | 3,539 | 40.7 | −1.1 |
| | Labour | Jacqueline Martin | 3,155 | 36.2 | −2.8 |
| | Liberal Democrats | Barry Fleet | 1,431 | 16.4 | +3.0 |
| | Green | Stephen Hicks | 581 | 6.7 | +0.9 |
| Majority | 384 | 4.4 | +1.7 |
| Turnout | 8,706 | 63.5 | +0.9 |
| | Conservative hold | Swing | +0.9 | |
Brentwood
District summary
| Party | Seats | +/- | Votes | % | +/- |
| | Conservative | 4 | | 17,868 | 49.3 | +7.8 |
| | Liberal Democrat | 0 | 1 | 10,750 | 29.6 | −3.5 |
| | Labour | 0 | | 4,665 | 12.9 | −3.4 |
| | UKIP | 0 | | 1,930 | 5.3 | +5.3 |
| | Green | 0 | | 1,054 | 2.9 | −0.2 |
Division results
Brentwood Hutton | Party | Candidate | Votes | % | ±% |
| | Conservative | John Roberts * | 5,734 | 57.8 | +9.2 |
| | Liberal Democrats | Richard Davies | 2,292 | 23.1 | −3.4 |
| | Labour | Bernadette Pavitt | 1,332 | 13.4 | −3.6 |
| | UKIP | Derek Camp | 563 | 5.7 | New |
| Majority | 3,442 | 34.7 | +12.5 |
| Turnout | 9,921 | 68.8 | +1.7 |
| | Conservative hold | Swing | +6.3 | |
Brentwood North | Party | Candidate | Votes | % | ±% |
| | Conservative | Philip Baker * | 4,102 | 46.7 | +11.0 |
| | Liberal Democrats | Doris Suckling | 2,687 | 30.6 | −3.7 |
| | Labour | Michele Wigram | 1,143 | 13.0 | −1.0 |
| | Green | Frank Seckleman | 431 | 4.9 | +1.9 |
| | UKIP | Yvonne Maguire | 419 | 4.8 | New |
| Majority | 1,415 | 16.1 | +14.7 |
| Turnout | 8,782 | 67.8 | −1.1 |
| | Conservative hold | Swing | +7.3 | |
Brentwood Rural | Party | Candidate | Votes | % | ±% |
| | Conservative | Roger Dyson * | 4,751 | 49.7 | +9.0 |
| | Liberal Democrats | Barry Aspinell * | 3,060 | 32.0 | −5.5 |
| | Labour | Vicki Hann | 834 | 8.7 | −2.5 |
| | UKIP | Michael Heaslip | 616 | 6.4 | New |
| | Green | Beryl Lankaster | 298 | 3.1 | −0.2 |
| Majority | 1,691 | 17.7 | +14.5 |
| Turnout | 9,559 | 71.1 | +3.2 |
| | Conservative hold | Swing | +7.3 | |
Brentwood South | Party | Candidate | Votes | % | ±% |
| | Conservative | Lionel Lee * | 3,281 | 41.0 | +2.2 |
| | Liberal Democrats | David Kendall | 2,711 | 33.9 | +2.2 |
| | Labour | Michael Le-Surf | 1,356 | 16.9 | −7.8 |
| | UKIP | Jeanette Gulleford | 332 | 4.1 | New |
| | Green | Dean Swift | 325 | 4.1 | −0.8 |
| Majority | 570 | 7.1 | +0.0 |
| Turnout | 8,005 | 65.2 | −0.4 |
| | Conservative hold | Swing | -0.0 | |
Castle Point
District summary
| Party | Seats | +/- | Votes | % | +/- |
| | Conservative | 5 | 1 | 20,774 | 50.2 | +1.4 |
| | Labour | 0 | 2 | 14,185 | 34.3 | −5.6 |
| | Liberal Democrat | 0 | | 4,470 | 10.8 | +0.3 |
| | Green | 0 | | 1,936 | 4.7 | +3.9 |
Division results
Canvey Island East | Party | Candidate | Votes | % | ±% |
| | Conservative | Mark Howard | 3,944 | 45.3 | +4.8 |
| | Labour | Dennis Williams * | 3,645 | 41.9 | −5.7 |
| | Liberal Democrats | Deborah Wood | 718 | 8.2 | +0.5 |
| | Green | Christopher Keane | 397 | 4.6 | +0.5 |
| Majority | 299 | 3.4 | |
| Turnout | 8,704 | 56.4 | +3.0 |
| | Conservative gain from Labour | Swing | +5.2 | |
Canvey Island West | Party | Candidate | Votes | % | ±% |
| | Conservative | Raymond Howard * | 3,727 | 50.8 | −4.9 |
| | Labour | Vincent Heatherson | 2,782 | 37.9 | −0.1 |
| | Liberal Democrats | Shirley Howe | 556 | 7.6 | +1.3 |
| | Green | Irene Willis | 269 | 3.7 | New |
| Majority | 945 | 12.9 | −4.8 |
| Turnout | 7,334 | 52.7 | −0.4 |
| | Conservative hold | Swing | −2.4 | |
Hadleigh | Party | Candidate | Votes | % | ±% |
| | Conservative | Jillian Reeves * | 4,998 | 55.6 | +1.4 |
| | Labour | Jacqueline Reilly | 2,229 | 24.8 | −4.7 |
| | Liberal Democrats | Elizabeth Jones | 1,028 | 11.4 | −4.9 |
| | Green | Vikki Copping | 735 | 8.2 | New |
| Majority | 2,769 | 30.8 | +6.2 |
| Turnout | 8,990 | 65.6 | +2.3 |
| | Conservative hold | Swing | +3.1 | |
South Benfleet | Party | Candidate | Votes | % |
| | Conservative | Colin Riley | 4,226 | 50.4 |
| | Labour | Lorna Trollope | 2,627 | 31.3 |
| | Liberal Democrats | Barry Newman | 1,357 | 16.2 |
| | Green | Nanine Pachy | 175 | 2.1 |
| Majority | 1,599 | 19.1 |
| Turnout | 8,385 | 63.2 |
| | Conservative win (new seat) |
Thundersley | Party | Candidate | Votes | % | ±% |
| | Conservative | William Dick * | 3,879 | 48.8 | −0.2 |
| | Labour | Joseph Cooke | 2,902 | 36.5 | −1.7 |
| | Liberal Democrats | Paul Westlake | 811 | 10.2 | −2.6 |
| | Green | Eileen Peck | 360 | 4.5 | New |
| Majority | 977 | 12.3 | +1.6 |
| Turnout | 7,952 | 63.1 | +3.6 |
| | Conservative hold | Swing | +0.8 | |
Chelmsford
District summary
| Party | Seats | +/- | Votes | % | +/- |
| | Liberal Democrat | 5 | 1 | 25,143 | 31.7 | +0.4 |
| | Conservative | 4 | | 34,553 | 43.6 | +3.4 |
| | Labour | 0 | 1 | 14,265 | 18.0 | −6.6 |
| | Green | 0 | | 3,927 | 5.0 | +1.1 |
| | SWFCTA | 0 | | 807 | 1.0 | +1.0 |
| | UKIP | 0 | | 464 | 0.6 | +0.6 |
| | Veritas | 0 | | 158 | 0.2 | +0.2 |
Division results
Broomfield and Writtle | Party | Candidate | Votes | % | ±% |
| | Conservative | John Aldridge | 4,271 | 45.4 | +1.6 |
| | Liberal Democrats | John Hunnable | 2,565 | 27.2 | −3.4 |
| | Labour | Prudence Jones | 1,603 | 17.0 | −5.0 |
| | Green | Andrew Tinsley | 513 | 5.4 | +1.8 |
| | UKIP | Charles Cole | 464 | 4.9 | New |
| Majority | 1,706 | 18.1 | +5.0 |
| Turnout | 9,416 | 66.4 | +1.9 |
| | Conservative hold | Swing | +2.5 | |
Chelmer | Party | Candidate | Votes | % |
| | Conservative | Peter Martin * | 5,364 | 53.5 |
| | Liberal Democrats | David Whiteing | 2,280 | 22.7 |
| | Labour | David Howell | 1,737 | 17.3 |
| | Green | Eleanor Burgess | 650 | 6.5 |
| Majority | 3,084 | 30.7 |
| Turnout | 10,031 | 63.1 |
| | Conservative win (new seat) |
Chelmsford Central | Party | Candidate | Votes | % |
| | Liberal Democrats | Keith Francis | 2,785 | 38.0 |
| | Conservative | David Lee | 2,584 | 35.3 |
| | Labour | John Leslie | 1,531 | 20.9 |
| | Green | Douglas Copping | 430 | 5.9 |
| Majority | 201 | 2.7 |
| Turnout | 7,330 | 62.5 |
| | Liberal Democrats win (new seat) |
Chelmsford North | Party | Candidate | Votes | % | ±% |
| | Liberal Democrats | Tom Smith-Hughes * | 3,276 | 39.1 | +0.5 |
| | Conservative | Delmas Ashford | 2,726 | 32.6 | +3.9 |
| | Labour | Joan Bliss | 2,031 | 24.3 | −5.9 |
| | Green | Angela Thomson | 341 | 4.1 | +1.5 |
| Majority | 550 | 6.6 | −1.8 |
| Turnout | 8,374 | 60.7 | −0.6 |
| | Liberal Democrats hold | Swing | −1.7 | |
Chelmsford West | Party | Candidate | Votes | % | ±% |
| | Liberal Democrats | Ian Gale * | 2,876 | 36.0 | +3.6 |
| | Conservative | Amar Bajaj | 2,365 | 29.6 | +3.4 |
| | Labour | Neil Spurgeon * | 2,161 | 27.1 | −11.0 |
| | Green | Clifford Hughes | 426 | 5.3 | +2.0 |
| | Veritas | Stephen Stratton | 158 | 2.0 | New |
| Majority | 511 | 6.4 | +0.8 |
| Turnout | 7,986 | 56.5 | +0.5 |
| | Liberal Democrats gain from Labour | Swing | +7.3 | |
Great Baddow | Party | Candidate | Votes | % | ±% |
| | Liberal Democrats | Maureen Miller * | 3,774 | 39.3 | −3.5 |
| | Conservative | David Stevenson | 3,571 | 37.2 | +4.8 |
| | Labour | Peter Dixon | 1,803 | 18.8 | −2.4 |
| | Green | Colin Budgey | 449 | 4.7 | +1.1 |
| Majority | 203 | 2.1 | −8.4 |
| Turnout | 9,597 | 63.5 | +1.7 |
| | Liberal Democrats hold | Swing | −4.2 | |
South Woodham Ferrers | Party | Candidate | Votes | % |
| | Conservative | Norman Hume * | 3,950 | 51.5 |
| | Labour | Robert Jones | 1,403 | 18.3 |
| | Liberal Democrats | Jenifer Goldfinch | 1,260 | 16.4 |
| | SWFCTA | Ian Roberts | 807 | 10.5 |
| | Green | Valerie Thompson | 251 | 3.3 |
| Majority | 2,547 | 33.2 |
| Turnout | 7,671 | 59.6 |
| | Conservative win (new seat) |
Springfield | Party | Candidate | Votes | % | ±% |
| | Liberal Democrats | Michael Mackrory | 4,095 | 41.5 | +13.7 |
| | Conservative | John Spence | 3,778 | 38.3 | −6.4 |
| | Labour | William Horslen | 1,996 | 20.2 | −2.7 |
| Majority | 317 | 3.2 | |
| Turnout | 9,869 | 62.5 | +1.8 |
| | Liberal Democrats gain from Conservative | Swing | +10.1 | |
Stock | Party | Candidate | Votes | % | ±% |
| | Conservative | Paul White * | 5,944 | 65.7 | +12.7 |
| | Liberal Democrats | Angela Robinson | 2,232 | 24.7 | +9.2 |
| | Green | Dawn Holmes | 867 | 9.6 | +5.0 |
| Majority | 3,712 | 41.0 | +14.9 |
| Turnout | 9,043 | 66.4 | +2.9 |
| | Conservative hold | Swing | +1.8 | |
Colchester
District summary
| Party | Seats | +/- | Votes | % | +/- |
| | Conservative | 4 | | 27,580 | 37.4 | −1.0 |
| | Liberal Democrat | 3 | | 23,089 | 31.3 | −0.6 |
| | Labour | 2 | | 16,940 | 23.0 | −5.4 |
| | Green | 0 | | 4,845 | 6.6 | +5.4 |
| | Independent | 0 | | 1,263 | 1.7 | +1.7 |
Division results
Abbey division | Party | Candidate | Votes | % |
| | Liberal Democrats | Margaret Fisher * | 3,384 | 42.9 |
| | Labour | Scott Harris | 1,846 | 23.4 |
| | Conservative | David Adams | 1,806 | 22.9 |
| | Green | Peter Lynn | 852 | 10.8 |
| Majority | 1,538 | 19.5 |
| Turnout | 7,888 | 52.4 |
| | Liberal Democrats win (new seat) |
Constable division | Party | Candidate | Votes | % | ±% |
| | Conservative | Anthony Clover * | 4,943 | 50.1 | −2.0 |
| | Liberal Democrats | John Stevens | 2,333 | 23.6 | −3.0 |
| | Labour | John Wood | 1,925 | 19.5 | −1.9 |
| | Green | Roger Bamforth | 673 | 6.8 | New |
| Majority | 2,610 | 26.5 | +1.1 |
| Turnout | 9,874 | 67.7 | +0.3 |
| | Conservative hold | Swing | +0.5 | |
Drury division | Party | Candidate | Votes | % | ±% |
| | Conservative | Jeremy Lucas * | 4,049 | 43.9 | +2.7 |
| | Liberal Democrats | Gwendoline Ilott | 3,030 | 32.9 | −5.4 |
| | Labour | David Hough | 1,517 | 16.5 | −4.1 |
| | Green | Timothy Glover | 618 | 6.7 | New |
| Majority | 1,019 | 11.0 | +8.0 |
| Turnout | 9,214 | 67.8 | +2.4 |
| | Conservative hold | Swing | +4.0 | |
Maypole division | Party | Candidate | Votes | % | ±% |
| | Labour | Richard Bourne * | 2,226 | 34.8 | −2.1 |
| | Liberal Democrats | William Frame | 2,035 | 31.8 | −4.3 |
| | Conservative | Robert Davidson | 1,837 | 28.7 | +1.8 |
| | Green | Philippa Lane | 299 | 4.7 | New |
| Majority | 191 | 3.0 | +2.2 |
| Turnout | 6,397 | 52.8 | +3.8 |
| | Labour hold | Swing | +1.1 | |
Mersea and Tiptree division | Party | Candidate | Votes | % |
| | Conservative | Christopher Manning-Press * | 4,129 | 44.8 |
| | Labour | Audrey Spencer | 1,916 | 20.8 |
| | Liberal Democrats | Craig Sutton | 1,491 | 16.2 |
| | Independent | Jonathan Longman | 1,263 | 13.7 |
| | Green | Howard Mettler | 428 | 4.6 |
| Majority | 2,213 | 24.0 |
| Turnout | 9,227 | 64.5 |
| | Conservative win (new seat) |
Mile End and Highwoods division | Party | Candidate | Votes | % |
| | Liberal Democrats | Anne Turrell * | 2,646 | 38.1 |
| | Conservative | Donald Henshall | 2,619 | 37.7 |
| | Labour | Richard Bingley | 1,282 | 18.4 |
| | Green | Mary Bryan | 403 | 5.8 |
| Majority | 27 | 0.4 |
| Turnout | 6,950 | 57.6 |
| | Liberal Democrats win (new seat) |
Parsons Heath and East Gates division | Party | Candidate | Votes | % |
| | Liberal Democrats | Theresa Higgins * | 3,312 | 43.4 |
| | Conservative | Simon Smith | 2,280 | 29.9 |
| | Labour | Kim Naish | 1,647 | 21.6 |
| | Green | Maria Iacovou | 390 | 5.1 |
| Majority | 1,032 | 13.5 |
| Turnout | 7,629 | 60.3 |
| | Liberal Democrats win (new seat) |
Stanway and Pyefleet division | Party | Candidate | Votes | % |
| | Conservative | John Jowers | 4,036 | 44.3 |
| | Liberal Democrats | Hannah James | 2,739 | 30.0 |
| | Labour | John Spademan | 1,825 | 20.0 |
| | Green | Patience Rogers | 514 | 5.6 |
| Majority | 1,297 | 14.3 |
| Turnout | 9,114 | 65.2 |
| | Conservative win (new seat) |
Wivenhoe St. Andrew division | Party | Candidate | Votes | % | ±% |
| | Labour | Julie Young * | 2,756 | 37.1 | −6.0 |
| | Liberal Democrats | Jeremy Jacobs | 2,119 | 28.5 | +1.4 |
| | Conservative | Neil Stock | 1,881 | 25.3 | −4.3 |
| | Green | Christopher Fox | 668 | 9.0 | New |
| Majority | 637 | 8.6 | −4.9 |
| Turnout | 7,424 | 50.9 | +1.9 |
| | Labour hold | Swing | −3.7 | |
Epping Forest
District summary
| Party | Seats | +/- | Votes | % | +/- |
| | Conservative | 6 | 1 | 28,519 | 49.1 | +3.0 |
| | Loughton Residents | 1 | | 2,734 | 4.7 | +0.4 |
| | Liberal Democrat | 0 | 2 | 13,167 | 22.7 | −1.8 |
| | Labour | 0 | | 10,171 | 17.5 | −7.5 |
| | Green | 0 | | 1,712 | 2.9 | +2.9 |
| | BNP | 0 | | 1,391 | 2.4 | +2.4 |
| | English Democrats | 0 | | 368 | 0.6 | +0.6 |
Division results
Buckhurst Hill and Loughton South | Party | Candidate | Votes | % |
| | Conservative | Colin Finn * | 4,780 | 48.8 |
| | Liberal Democrats | Ann Haigh * | 3,438 | 35.1 |
| | Labour | Paul Bostock | 1,580 | 16.1 |
| Majority | 1,342 | 13.7 |
| Turnout | 9,798 | 65.8 |
| | Conservative win (new seat) |
Chigwell and Loughton Broadway | Party | Candidate | Votes | % |
| | Conservative | Michael Tomkins * | 3,748 | 49.8 |
| | Labour | Thomas Owen | 1,551 | 20.6 |
| | Liberal Democrats | Peter Spencer | 1,349 | 17.9 |
| | BNP | Thomas Richardson | 623 | 8.3 |
| | Green | Gillian Askew | 255 | 3.4 |
| Majority | 2,197 | 29.2 |
| Turnout | 7,526 | 60.3 |
| | Conservative win (new seat) |
Epping and Theydon Bois | Party | Candidate | Votes | % |
| | Conservative | Terence Spencer | 3,496 | 41.9 |
| | Liberal Democrats | Janet Whitehouse * | 3,375 | 40.4 |
| | Labour | Michael Sellears | 827 | 9.9 |
| | English Democrat | Robin Tilbrook | 368 | 4.4 |
| | Green | Korinna Willis | 284 | 3.4 |
| Majority | 121 | 1.4 |
| Turnout | 8,350 | 66.9 |
| | Conservative win (new seat) |
Loughton Central | Party | Candidate | Votes | % |
| | Loughton Residents | Chris Pond | 2,734 | 35.2 |
| | Conservative | Matthew Hayday | 2,175 | 28.0 |
| | Labour | Margaret Owen | 1,331 | 17.2 |
| | BNP | Patricia Richardson | 768 | 9.9 |
| | Liberal Democrats | Lucille Thompson | 483 | 6.2 |
| | Green | Jennifer Hart | 269 | 3.5 |
| Majority | 559 | 7.2 |
| Turnout | 7,760 | 61.6 |
| | Loughton Residents win (new seat) |
North Weald and Nazeing | Party | Candidate | Votes | % | ±% |
| | Conservative | Anthony Jackson * | 5,301 | 58.3 | −0.9 |
| | Labour | Kelvin Morris | 1,654 | 18.2 | −8.6 |
| | Liberal Democrats | Janet Hedges | 1,623 | 17.9 | +3.9 |
| | Green | Peter Goldsmith | 511 | 5.6 | New |
| Majority | 3,647 | 40.1 | +7.6 |
| Turnout | 9,089 | 69.9 | +7.0 |
| | Conservative hold | Swing | +3.8 | |
Ongar and Rural | Party | Candidate | Votes | % |
| | Conservative | Gerard McEwan * | 4,397 | 59.6 |
| | Liberal Democrats | Derek Jacobs | 1,729 | 23.4 |
| | Labour | Sheila Spring | 1,254 | 17.0 |
| Majority | 2,668 | 36.2 |
| Turnout | 7,380 | 67.0 |
| | Conservative win (new seat) |
Waltham Abbey | Party | Candidate | Votes | % | ±% |
| | Conservative | Elizabeth Webster * | 4,622 | 56.6 | +3.4 |
| | Labour | Peter Sheen | 1,974 | 24.2 | −11.3 |
| | Liberal Democrats | Patricia Brooks | 1,170 | 14.3 | +3.0 |
| | Green | Barry Johns | 393 | 4.8 | New |
| Majority | 2,648 | 32.5 | +14.8 |
| Turnout | 8,159 | 53.2 | +0.4 |
| | Conservative hold | Swing | +7.4 | |
Harlow
District summary
| Party | Seats | +/- | Votes | % | +/- |
| | Labour | 3 | 2 | 20,154 | 41.4 | −3.5 |
| | Conservative | 1 | 1 | 18,094 | 37.2 | +5.3 |
| | Liberal Democrat | 0 | | 8,368 | 17.2 | −6.0 |
| | Green | 0 | | 2,011 | 4.1 | +4.1 |
Division results
Harlow North | Party | Candidate | Votes | % |
| | Labour | Paul Sztumpf * | 3,863 | 42.1 |
| | Conservative | Jane Steer | 3,095 | 33.8 |
| | Liberal Democrats | Christopher Millington | 1,716 | 18.7 |
| | Green | Miles Willis | 495 | 5.4 |
| Majority | 768 | 8.4 |
| Turnout | 9,169 | 63.6 |
| | Labour win (new seat) |
Harlow South East | Party | Candidate | Votes | % |
| | Conservative | Edward Johnson | 3,552 | 41.5 |
| | Labour | Patricia Larkin | 3,224 | 37.6 |
| | Liberal Democrats | Linda Pailing | 1,479 | 17.3 |
| | Green | Michael Gould | 311 | 3.6 |
| Majority | 328 | 3.8 |
| Turnout | 8,566 | 61.8 |
| | Conservative win (new seat) |
Harlow West | Party | Candidate | Votes | % |
| | Labour | Anthony Durcan * | 6,568 | 42.5 |
| | Labour | Jenny Holland * | 6,499 | 42.1 |
| | Conservative | Christopher Ford | 5,807 | 37.6 |
| | Conservative | Joshua Jolles | 5,640 | 36.5 |
| | Liberal Democrats | Robert Thurston | 2,696 | 17.5 |
| | Liberal Democrats | Nicholas Macy | 2,477 | 16.0 |
| | Green | Robert Wight | 1,205 | 7.8 |
| Turnout | 15,446 | 56.3 |
| | Labour win (new seat) |
| | Labour win (new seat) |
Maldon
District summary
| Party | Seats | +/- | Votes | % | +/- |
| | Conservative | 3 | | 15,622 | 51.3 | +2.8 |
| | Labour | 0 | | 7,235 | 23.8 | −5.1 |
| | Liberal Democrat | 0 | | 5,233 | 17.2 | +1.0 |
| | Green | 0 | | 2,351 | 7.7 | +1.2 |
Division results
Heybridge and Tollesbury | Party | Candidate | Votes | % |
| | Conservative | Rodney Bass * | 5,305 | 51.4 |
| | Labour | Norman Hunt | 2,162 | 21.0 |
| | Liberal Democrats | Gerald Townshead | 1,905 | 18.5 |
| | Green | Jonathan King | 943 | 9.1 |
| Majority | 3,143 | 30.5 |
| Turnout | 10,315 | 68.7 |
| | Conservative win (new seat) |
Maldon | Party | Candidate | Votes | % | ±% |
| | Conservative | Brian Mead * | 4,588 | 49.2 | +2.4 |
| | Labour | Michael Bentley | 2,461 | 26.4 | −6.2 |
| | Liberal Democrats | Janetta Sosin | 1,603 | 17.2 | +3.3 |
| | Green | Michael Cole | 672 | 7.2 | +0.7 |
| Majority | 2,127 | 22.8 | |
| Turnout | 9,324 | 65.8 | |
| | Conservative hold | Swing | | |
Southminster | Party | Candidate | Votes | % | ±% |
| | Conservative | Robert Boyce * | 5,729 | 53.0 | +3.6 |
| | Labour | Mary Feakins | 2,612 | 24.2 | −5.3 |
| | Liberal Democrats | James Hutchon | 1,725 | 16.0 | +1.2 |
| | Green | Robert King | 736 | 6.8 | +0.6 |
| Majority | | | |
| Turnout | | | |
| | Conservative hold | Swing | | |
Rochford
District summary
| Party | Seats | +/- | Votes | % | +/- |
| | Conservative | 5 | | 20,369 | 50.1 | +3.0 |
| | Labour | 0 | | 9,504 | 23.4 | −4.0 |
| | Liberal Democrat | 0 | | 8,353 | 20.5 | −1.8 |
| | Green | 0 | | 2,463 | 6.1 | +6.1 |
Division results
Rayleigh North | Party | Candidate | Votes | % | ±% |
| | Conservative | Stephen Castle * | 3,815 | 44.7 | −3.2 |
| | Liberal Democrats | Christopher Black | 2,908 | 34.1 | +1.9 |
| | Labour | Stephen Hinde | 1,382 | 16.2 | −3.8 |
| | Green | Neil Kirsh | 432 | 5.1 | New |
| Majority | | | |
| Turnout | | | |
| | Conservative hold | Swing | | |
Rayleigh South | Party | Candidate | Votes | % | ±% |
| | Conservative | Mavis Webster * | 4,180 | 53.9 | +9.2 |
| | Liberal Democrats | Keith Budden | 1,617 | 20.9 | −11.3 |
| | Labour | Hilary Dyer | 1,577 | 20.3 | +0.3 |
| | Green | Peggy-Jane Smith | 376 | 4.9 | New |
| Majority | | | |
| Turnout | | | |
| | Conservative hold | Swing | | |
Rochford North | Party | Candidate | Votes | % | ±% |
| | Conservative | Tracey Chapman * | 4,262 | 51.8 | +8.7 |
| | Labour | Allan Davies | 1,809 | 22.0 | −3.1 |
| | Liberal Democrats | Victor Leach | 1,555 | 18.9 | +1.3 |
| | Green | Andrew Vaughan | 607 | 7.4 | New |
| Majority | | | |
| Turnout | | | |
| | Conservative hold | Swing | | |
Rochford South | Party | Candidate | Votes | % | ±% |
| | Conservative | Roy Pearson * | 3,324 | 46.8 | −0.2 |
| | Labour | Graham Fox | 2,460 | 34.6 | −6.4 |
| | Liberal Democrats | John Masek | 867 | 12.2 | +0.2 |
| | Green | Robin Hume | 453 | 6.4 | New |
| Majority | | | |
| Turnout | | | |
| | Conservative hold | Swing | | |
Rochford West | Party | Candidate | Votes | % | ±% |
| | Conservative | Elizabeth Hart * | 4,788 | 52.8 | −0.7 |
| | Labour | Michael Hoy | 2,276 | 25.1 | −4.4 |
| | Liberal Democrats | Mark Pearson | 1,406 | 15.5 | −1.6 |
| | Green | Gabrielle Yeadell | 595 | 6.6 | New |
| Majority | | | |
| Turnout | | | |
| | Conservative hold | Swing | | |
Tendring
District summary
| Party | Seats | +/- | Votes | % | +/- |
| | Conservative | 5 | | 28,408 | 40.9 | +3.4 |
| | Labour | 2 | 1 | 18,857 | 27.2 | −9.4 |
| | CRP | 1 | 1 | 6,003 | 8.6 | +3.2 |
| | Liberal Democrat | 0 | | 13,072 | 18.8 | −0.9 |
| | Green | 0 | | 3,101 | 4.5 | +4.1 |
Division results
Brightlingsea | Party | Candidate | Votes | % | ±% |
| | Conservative | Derek Robinson * | 4,157 | 45.1 | +3.9 |
| | Labour | Colin Olivier | 2,327 | 25.2 | −4.8 |
| | Liberal Democrats | Gary Scott | 2,258 | 24.5 | −1.1 |
| | Green | Nicholas Scales | 478 | 5.2 | +2.0 |
| Majority | | | |
| Turnout | | | |
| | Conservative hold | Swing | | |
Clacton East | Party | Candidate | Votes | % | ±% |
| | Conservative | Pierre Oxley | 4,330 | 51.3 | +11.2 |
| | Labour | Roy Raby | 2,427 | 28.8 | −4.2 |
| | Liberal Democrats | Victor Brown | 1,206 | 14.3 | +1.4 |
| | Green | Cheryl Gerrard | 263 | 3.1 | New |
| | Community Representative | Fraser Leeks | 207 | 2.5 | −11.5 |
| Majority | | | |
| Turnout | | | |
| | Conservative hold | Swing | | |
Clacton North | Party | Candidate | Votes | % | ±% |
| | Labour | Clive Baker * | 2,809 | 39.4 | +1.0 |
| | Conservative | Paul Honeywood | 2,200 | 30.8 | +0.9 |
| | Liberal Democrats | Harold Shearing | 1,746 | 24.5 | −7.1 |
| | Community Representative | Kevin Watson | 204 | 2.9 | New |
| | Green | Patricia Brunton | 174 | 2.4 | New |
| Majority | | | |
| Turnout | | | |
| | Labour hold | Swing | | |
Clacton West | Party | Candidate | Votes | % | ±% |
| | Community Representative | Roy Smith * | 2,109 | 30.8 | New |
| | Conservative | Christopher Griffiths | 1,988 | 29.1 | +0.2 |
| | Labour | Maurice Alexander | 1,863 | 27.2 | −33.6 |
| | Liberal Democrats | Susan Shearing | 747 | 10.9 | +0.6 |
| | Green | Rachel Brunton | 136 | 2.0 | New |
| Majority | | | |
| Turnout | | | |
| | Community Representative gain from Labour | Swing | | |
Frinton and Walton | Party | Candidate | Votes | % | ±% |
| | Conservative | Michael Page | 6,112 | 56.8 | +1.2 |
| | Labour | Richard Hebborn | 2,633 | 24.5 | −3.8 |
| | Liberal Democrats | Charles Harrison | 1,658 | 15.4 | −0.7 |
| | Green | Walter Schwartz | 358 | 3.3 | New |
| Majority | | | |
| Turnout | | | |
| | Conservative hold | Swing | | |
Harwich | Party | Candidate | Votes | % | ±% |
| | Labour | Leslie Double * | 3,847 | 42.3 | −2.8 |
| | Community Representative | Steven Henderson | 2,847 | 31.3 | +6.3 |
| | Conservative | Denzil Watson | 1,887 | 20.7 | −0.3 |
| | Green | Ketherine Bamforth | 519 | 5.7 | New |
| Majority | | | |
| Turnout | | | |
| | Labour hold | Swing | | |
Tendring Rural East | Party | Candidate | Votes | % | ±% |
| | Conservative | Mark Cossens | 3,805 | 40.5 | +0.2 |
| | Labour | Lawrence Payne | 2,951 | 31.4 | −0.5 |
| | Liberal Democrats | Robert Bevan | 2,142 | 22.8 | +0.7 |
| | Green | Samuel Elliott | 289 | 3.1 | New |
| | Community Representative | John Brown | 208 | 2.2 | −3.6 |
| Majority | | | |
| Turnout | | | |
| | Conservative hold | Swing | | |
Tendring Rural West | Party | Candidate | Votes | % | ±% |
| | Conservative | Sarah Candy * | 3,929 | 45.9 | +7.3 |
| | Liberal Democrats | Ann Elvin | 3,315 | 38.7 | +7.2 |
| | Green | Michael Mealing | 884 | 10.3 | New |
| | Community Representative | David Smy | 428 | 5.0 | New |
| Majority | | | |
| Turnout | | | |
| | Conservative hold | Swing | | |
Uttlesford
District summary
| Party | Seats | +/- | Votes | % | +/- |
| | Conservative | 4 | | 18,095 | 48.3 | +0.4 |
| | Liberal Democrat | 0 | | 12,724 | 34.0 | +1.7 |
| | Labour | 0 | | 3,587 | 9.6 | −8.8 |
| | Green | 0 | | 2,582 | 6.9 | +5.5 |
| | UKIP | 0 | | 462 | 1.2 | +1.2 |
Division results
Dunmow | Party | Candidate | Votes | % | ±% |
| | Conservative | Susan Flack * | 5,498 | 55.8 | |
| | Liberal Democrats | Richard Harris | 3,520 | 35.7 | |
| | Green | Michael Earley | 842 | 8.5 | |
| Majority | | | |
| Turnout | | | |
| | Conservative hold | Swing | | |
Saffron Walden | Party | Candidate | Votes | % | ±% |
| | Conservative | Robert Chambers * | 4,299 | 41.9 | |
| | Liberal Democrats | Joan Dawson | 3,237 | 31.5 | |
| | Labour | Simon Trimnell | 1,570 | 15.3 | |
| | Green | Trilby Roberts | 700 | 6.8 | |
| | UKIP | Raymond Tyler | 462 | 4.5 | |
| Majority | | | |
| Turnout | | | |
| | Conservative hold | Swing | | |
Stansted | Party | Candidate | Votes | % | ±% |
| | Conservative | Raymond Gooding | 3,932 | 43.6 | |
| | Liberal Democrats | Peter Wilcock | 3,779 | 41.9 | |
| | Labour | Betty McGregor | 904 | 10.0 | |
| | Green | Sanjukta Ghosh | 411 | 4.6 | |
| Majority | | | |
| Turnout | | | |
| | Conservative hold | Swing | | |
Thaxted | Party | Candidate | Votes | % | ±% |
| | Conservative | Simon Walsh | 4,366 | 52.6 | |
| | Liberal Democrats | Robert Wingard | 2,188 | 26.4 | |
| | Labour | Yvonne Morton | 1,113 | 13.4 | |
| | Green | Susan Halsted | 629 | 7.6 | |
| Majority | | | |
| Turnout | | | |
| | Conservative hold | Swing | | |
By-elections
Brentwood Rural
Brentwood Rural: 13 July 2006[4] | Party | Candidate | Votes | % | ±% |
| | Conservative | | 2,062 | 61.5 | +11.8 |
| | Liberal Democrats | | 1,150 | 34.3 | +2.3 |
| | Labour | | 142 | 4.2 | –4.5 |
| Majority | 912 | 27.2 | +9.5 |
| Turnout | 3,354 | | |
| | Conservative hold | Swing | 4.8 | |
No UKIP (6.4%) or Green (3.1%) candidates as previous.
References
- ^ "Clacton: Councillor suspended from party". gazette-news.co.uk/. Daily Gazette. 26 February 2002. Retrieved 26 July 2024.
- ^ "Essex". Retrieved 28 January 2014.
- ^ "Elections". Archived from the original on 2 February 2014. Retrieved 28 January 2014.
- ^ "Brentwood Rural Division - Essex". Andrew Teale. Local Elections Archive Project. Retrieved 11 January 2023.


 4
4  5
5 
 Council elections in Essex


