2012 UK local government election
2012 Rushmoor Borough Council election
|
|
All 39 seats to Rushmoor Borough Council
20 seats needed for a majority |
|---|
| | First party | Second party | Third party | | | | | | | Party | Conservative | Labour | UKIP | | Seats won | 25 | 11 | 3 | | Popular vote | 8,785 | 5,551 | 1,913 | |
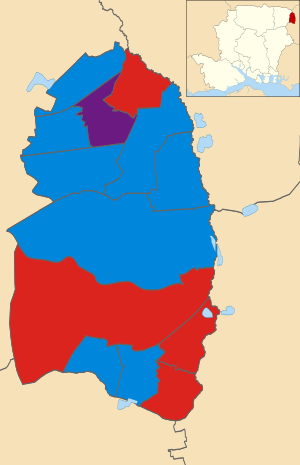 Results by Ward |
Council control before election
Conservative
| Council control after election
Conservative
| |
The 2012 Rushmoor Council elections took place on Thursday 3 May 2012 to elect members of Rushmoor Borough Council in Hampshire, England.
It was a very good night for the Labour Party and their Leader Cllr Keith Dibble who achieved the highest percentage vote on the night. Labour gained the three seats in the new Cherrywood ward in Farnborough. The first time Labour has had councillors in Farnborough for ten years.
The controlling Conservatives lost 5 seats, Labour gained 5, UKIP gained 1 and the Lib Dems lost all 4 seats. The Conservatives had a reduced majority
The whole of the council was up for election following a boundary review that has reorganised the distribution of council wards throughout the borough. The council will now be composed of 13 wards, each of which will elect three members to create a council of 39 councillors.
Election result
Rushmoor Local Election Result 2012 | Party | Seats | Gains | Losses | Net gain/loss | Seats % | Votes % | Votes | +/− |
| | Conservative | 25 | | 5 | -5 | | | | |
| | Labour | 11 | 5 | 0 | +5 | | | | |
| | Liberal Democrats | 0 | | 4 | -4 | | | | |
| | UKIP | 3 | 1 | 0 | +1 | | | | |
| | Christian | | | | | | | | |
Ward results
Aldershot
Aldershot Park[1] | Party | Candidate | Votes | % | ±% |
| | Labour | Terry Bridgeman | 677 | 49.45 | |
| | Labour | Don Cappleman | 754 | 55.08 | |
| | Liberal Democrats | Roland Collins | 202 | 14.76 | |
| | Conservative | Lucy Perrin | 401 | 29.29 | |
| | Labour | Mike Roberts | 811 | 59.24 | |
| | Conservative | Glen Slade | 451 | 32.94 | |
| | Conservative | Neil Watkin | 406 | 29.66 | |
| Turnout | 1,369 | 25.12 | |
Cherrywood
Cherrywood[1] | Party | Candidate | Votes | % | ±% |
| | UKIP | Albert Buddle | 212 | 15.41 | |
| | Liberal Democrats | Craig Card | 354 | 25.86 | |
| | Labour | Clive Grattan | 453 | 33.09 | |
| | Conservative | Jackie Hammond | 416 | 30.39 | |
| | Labour | Barry Jones | 445 | 32.51 | |
| | Liberal Democrats | Michael Manning | 361 | 26.37 | |
| | Conservative | Steve Masterton | 409 | 29.88 | |
| | Liberal Democrats | Shaun Murphy | 323 | 23.59 | |
| | Conservative | Mike Smith | 426 | 31.12 | |
| | Labour | Les Taylor | 435 | 31.78 | |
| Turnout | 1,369 | 26.6 | |
Cove and Southwood
Cove and Southwood[1] | Party | Candidate | Votes | % | ±% |
| | Labour | Clive Andrews | 342 | 21.42 | |
| | Conservative | Susan Carter | 940 | 58.90 | |
| | Conservative | Alan Chainey | 930 | 58.27 | |
| | Labour | Yvonne Hammond | 322 | 20.18 | |
| | Liberal Democrats | Brian Jupp | 298 | 18.67 | |
| | UKIP | Jane Shattock | 292 | 18.40 | |
| | Labour | Ed Shelton | 311 | 19.49 | |
| | Conservative | Martin Tennant | 804 | 50.38 | |
| Turnout | 1,596 | 28.8 | |
Empress
Empress[1] | Party | Candidate | Votes | % | ±% |
| | Liberal Democrats | Stephen Chowns | 311 | 23.44 | |
| | Conservative | David Clifford | 838 | 63.15 | |
| | Conservative | Gareth Lyon | 789 | 59.46 | |
| | Labour | Stephen Martin | 280 | 21.10 | |
| | Conservative | Brian Parker | 740 | 55.76 | |
| | Labour | Sharon Parkinson | 295 | 22.23 | |
| | Labour | Christopher Wright | 304 | 22.91 | |
| Turnout | 1,327 | 29.7 | |
Fernhill
Fernhill[1] | Party | Candidate | Votes | % | ±% |
| | Labour | Martin Coule | 345 | 24.47 | |
| | Conservative | Alan Ferrier | 915 | 64.89 | |
| | Liberal Democrats | Hammy Hamilton | 262 | 18.58 | |
| | Labour | Peter Hayward | 300 | 21.28 | |
| | Conservative | John Marsh | 892 | 63.26 | |
| | Conservative | Ken Muschamp | 860 | 61.00 | |
| | Labour | Robin Vyrnwy-Price | 296 | 21.00 | |
| Turnout | 1,410 | 25.6 | |
Knellwood
Knellwood[1] | Party | Candidate | Votes | % | ±% |
| | Conservative | Roland Dibbs | 1099 | 61.1 | |
| | Conservative | Adam Jackman | 1084 | 60.22 | |
| | Liberal Democrats | June Mackie | 428 | 23.78 | |
| | Labour | Trevor Simpson | 344 | 19.11 | |
| | Labour | June Smith | 439 | 24.39 | |
| | Conservative | Paul Taylor | 1105 | 61.39 | |
| | Labour | William Tootill | 353 | 19.61 | |
| Turnout | 1,800 | 31.6 | |
Manor Park
Manor Park[1] | Party | Candidate | Votes | % | ±% |
| | Liberal Democrats | Maurice Banner | 189 | 12.69 | |
| | Conservative | Peter Crerar | 736 | 49.43 | |
| | Conservative | Ron Hughes | 744 | 49.97 | |
| | Labour | Lesley Pestridge | 422 | 28.34 | |
| | UKIP | Eddie Poole | 281 | 18.87 | |
| | Labour | Carol Rust | 446 | 29.95 | |
| | Labour | Dominique Swaddling | 407 | 27.33 | |
| | Conservative | Bruce Thomas | 617 | 41.44 | |
| Turnout | 1,489 | 26.17 | |
North Town
North Town[1] | Party | Candidate | Votes | % | ±% |
| | Conservative | Lee Dawson | 334 | 25.59 | |
| | Labour | Keith Dibble | 907 | 69.50 | |
| | Labour | Susan Dibble | 832 | 63.75 | |
| | Conservative | Norma Francis-Crerar | 307 | 23.52 | |
| | Labour | Frank Rust | 804 | 61.61 | |
| | Conservative | Calum Stewart | 369 | 28.28 | |
| Turnout | 1,305 | 26.31 | |
Rowhill
Rowhill[1] | Party | Candidate | Votes | % | ±% |
| | Conservative | Charles Choudhary | 765 | 48.57 | |
| | Conservative | Sophia Choudhary | 753 | 47.81 | |
| | Labour | Jill Clark | 505 | 32.04 | |
| | Labour | Jim Dymond | 479 | 30.41 | |
| | Labour | Jan Matthews | 482 | 30.60 | |
| | Liberal Democrats | Pete Pearson | 317 | 20.13 | |
| | Conservative | David Welch | 808 | 51.30 | |
| Turnout | 1,575 | 29.72 | |
St John's
St John’s[1] | Party | Candidate | Votes | % | ±% |
| | Labour | Nick Bragger | 265 | 19.43 | |
| | Conservative | Barbara Hurst | 774 | 56.77 | |
| | Labour | Mary Lawrence | 284 | 20.82 | |
| | Labour | Donald MacGregor | 293 | 21.48 | |
| | Conservative | Peter Moyle | 780 | 57.18 | |
| | UKIP | Matthew Powers | 260 | 19.06 | |
| | Liberal Democrats | John Simpkins | 233 | 17.08 | |
| | Conservative | Jacqui Vosper | 738 | 54.11 | |
| Turnout | 1,364 | 25.9 | |
St Mark's
St Mark’s[1] | Party | Candidate | Votes | % | ±% |
| | Liberal Democrats | Crispin Allard | 483 | 33.85 | |
| | Conservative | Diane Bedford | 720 | 50.46 | |
| | Christian | Juliana Brimicombe | 93 | 6.52 | |
| | Conservative | Rod Cooper | 562 | 39.38 | |
| | Conservative | Liz Corps | 597 | 41.84 | |
| | Labour | Sohail Jannesari | 214 | 15.00 | |
| | Labour | Laura Jones | 249 | 17.45 | |
| | Liberal Democrats | Abul Chowdhury | 371 | 26.00 | |
| | Liberal Democrats | Alistair Mackie | 472 | 33.08 | |
| | Labour | Colin Southon | 220 | 15.42 | |
| Turnout | 1,427 | 28.6 | |
Wellington
Wellington[1] | Party | Candidate | Votes | % | ±% |
| | Conservative | Michael Ashworth | 181 | 39.69 | |
| | Conservative | Attika Choudhary | 191 | 41.89 | |
| | Labour | Alex Crawford | 220 | 48.25 | |
| | Labour | Jennifer Evans | 213 | 46.71 | |
| | Labour | Prabesh Kc | 186 | 40.79 | |
| | Liberal Democrats | Mitch Manning | 78 | 16.89 | |
| | Conservative | Eric Neal | 159 | 34.87 | |
| Turnout | 456 | 14.00 | |
West Heath
West Heath[1] | Party | Candidate | Votes | % | ±% |
| | Labour | Philip Collins | 237 | 13 | |
| | Conservative | Derek Cornwell | 498 | 27 | |
| | Liberal Democrats | Neville Dewey | 223 | 12 | |
| | Conservative | David Gilbert | 451 | 24 | |
| | Labour | Alex Hylan | 220 | 12 | |
| | Labour | Imtiaz Malik | 186 | 10 | |
| | Liberal Democrats | Jo Murphy | 252 | 14 | |
| | UKIP | Malcolm Small | 828 | 46 | |
| | UKIP | Steve Smith | 821 | 45 | |
| | UKIP | Mark Staplehurst | 868 | 47 | |
| | Conservative | David Thomas | 473 | 26 | |
| | Liberal Democrats | Philip Thompson | 230 | 13 | |
| Turnout | 1,816 | 35.9 | |
References
- ^ a b c d e f g h i j k l m "Statement of Persons Nominated". Rushmoor Borough Council. Retrieved 14 April 2012.


 Council elections in Hampshire


