2012 UK local government election
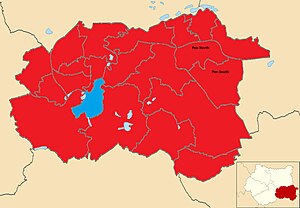
2012 local election results in Wakefield The 2012 Wakefield Metropolitan District Council election was held on 3 May 2012 to elect members of Wakefield Metropolitan District Council in West Yorkshire, England. One third of the council was up for election.
Council Make-up The make up of the Council after the election was:
Party political make-up of Wakefield Council Party Seats Current Council (2012) 2010[ 1] 2011[ 2] 2012[ 3] Labour 33 40 52 Conservative 24 20 11 Independent 5 3 0 Lib Dems 1 0 0
Election result Wakefield Local Election Result 2012 Party Seats Gains Losses Net gain/loss Seats % Votes % Votes +/− Labour 20 12 0 +12 95 56.2 41,147 +0.4 Conservative 1 0 9 -9 5 23.6 17,251 -6.3 UKIP 0 0 0 0 0 7.9 5,804 +4.8 Independent 0 0 3 -3 0 6.5 4,746 +3 Liberal Democrats 0 0 0 0 0 3.3 2,424 -1.7 Green 0 0 0 0 0 1.1 801 +0.2 English Democrat 0 0 0 0 0 0.8 594 +0.8 TUSC 0 0 0 0 0 0.1 76 -0.2
+/- compared with Wakefield Council election 2011.
Ward results
Ackworth, North Elmsall and Upton Party Candidate Votes % ±% Labour Martyn Ward 2,128 62.4 +10.2 Conservative Don Marshall 1,282 37.6 +3 Majority 846 24.8 +7.1 Turnout 3,410 26.9 −10.6 Labour gain from Conservative Swing
Airedale and Ferry Fryston ward Airedale and Ferry Fryston Party Candidate Votes % ±% Labour Les Shaw 1,977 73.3 −6.8 UKIP Arnie Craven 556 20.4 +20.4 Conservative Mellisa Wan Omer 171 6.3 −12.9 Majority 1,441 52.9 −8 Turnout 2,724 23.5 −4.7 Labour hold Swing
Altofts and Whitwood ward Altofts and Whitwood Party Candidate Votes % ±% Labour Peter Box 2,009 61.6 −2.5 UKIP David Armitage 783 24 +24 Conservative Steven Beeton 470 14.4 −10.7 Majority 1,226 37.6 −1.5 Turnout 3,262 25.8 −6.4 Labour hold Swing
Castleford Central and Glasshoughton ward Castleford Central and Glasshoughton Party Candidate Votes % ±% Labour Mark Burns-Williamson 2,306 76.3 +2.1 UKIP Alison Bullivant 482 15.9 +2.5 Conservative Eamonn Mullins 235 7.8 −4.2 Majority 1,824 60.3 −0.5 Turnout 3,023 24.8 Labour hold Swing
Crofton, Ryhill and Walton Party Candidate Votes % ±% Labour Faith Hepptinstall 2,582 67.3 +6.1 Conservative Allan Couch 1,253 32.7 +2.7 Majority 1,329 34.7 +3.5 Turnout 3,835 31.6 −8.1 Labour gain from Conservative Swing
Featherstone ward Featherstone Party Candidate Votes % ±% Labour June Cliffe 2,649 83.7 +21.4 Conservative Charles Scholes 516 16.3 +4.4 Majority 2,133 67.4 +30.3 Turnout 3,165 34.8 −9.6 Labour hold Swing
Hemsworth ward Hemsworth Party Candidate Votes % ±% Labour Shaun Hodson 1,779 57.5 −2 Independent Jim Kenyon 1,075 34.8 +7.2 Conservative Philip Davies 238 7.7 −4.3 Majority 704 22.8 −9.1 Turnout 3,092 25.7 −7.2 Labour gain from Independent Swing
Horbury and South Ossett ward Horbury and South Ossett Party Candidate Votes % ±% Labour Jack Hemingway 1,660 40.5 −8.2 Conservative Richard Wakefield 934 22.8 −18.2 Independent Graham Jesty 732 17.9 +17.9 UKIP Anthony Lumb 429 10.5 +10.5 Liberal Democrats Mark Goodair 340 8.3 −1.2 Majority 726 17.7 +10 Turnout 4,095 33.9 −7.5 Labour gain from Independent Swing
Knottingley ward Knottingley Party Candidate Votes % ±% Labour Graham Stokes 1,788 69.7 +12.2 UKIP Clinton Rhodes 494 19.3 +8.6 Conservative Jon Wadey 282 11 −4.7 Majority 1,294 50.5 +8.7 Turnout 2,564 23.8 −5.7 Labour hold Swing
Normanton ward Normanton Party Candidate Votes % ±% Labour Alan Wassell 1,775 62.9 −1 UKIP Bryan Barkley 712 25.2 +7.9 Conservative Emma-Jane Lisle 337 11.9 −6.4 Majority 1,063 37.6 −8 Turnout 2,824 22.3 −6.2 Labour hold Swing
Ossett ward Ossett Party Candidate Votes % ±% Labour Tony Richardson 1,991 49.2 +8.9 Conservative Terry Brown 1,453 35.9 −7.2 Liberal Democrats David Smith 606 15 −0.8 Majority 538 13.3 Turnout 4,050 31.9 −7.8 Labour gain from Conservative Swing
Pontefract North ward Pontefract North Party Candidate Votes % ±% Labour Paula Sherriff 1,649 47.9 −11.9 Independent Jack Kershaw 769 22.3 +22.3 Conservative Hannah Crowther 481 14 −9.6 UKIP Nathan Garbutt 368 10.7 0 Green Rennie Smith 103 3.0 −2.4 TUSC Daniel Dearden 76 2.2 +2.2 Majority 880 25.5 −10.6 Turnout 3,446 28.1 −3.1 Labour gain from Conservative Swing
Pontefract South Pontefract South Party Candidate Votes % ±% Labour Celia Loughran 2,222 50.4 −3.1 Conservative Mark Crowther 1,617 36.7 −9.1 UKIP Terence Edward Uttley 446 10.1 +10.1 Liberal Democrats Doug Dale 122 2.8 −10.1 Majority 605 13.7 −6 Turnout 4,407 36.6 −5.9 Labour gain from Conservative Swing
South Elmsall and South Kirkby ward South Elmsall and South Kirkby Party Candidate Votes % ±% Labour Michelle Collins 2,071 56.1 −21.5 Independent Wilf Benson 1,425 38.6 +38.6 Conservative Christian IAnson 197 5.3 −6.8 Majority 646 17.5 −48 Turnout 3,693 27.4 Labour gain from Independent Swing
Stanley and Outwood East ward Stanley and Outwood East Party Candidate Votes % ±% Labour Matthew Morley 2,135 61.4 +6.1 Conservative James Kildea 971 27.9 −8.1 Liberal Democrats Margaret Dodd 370 10.6 +2.6 Majority 1,164 33.5 +14.2 Turnout 3,476 28.4 −8.7 Labour gain from Conservative Swing
Wakefield East ward Wakefield East Party Candidate Votes % ±% Labour Ros Lund 1,741 50.9 +13.5 Independent Choudry Ikram 659 19.3 +19.3 Conservative Anthony Bracewell 596 17.4 −2.4 TUSC Michael Griffiths 327 9.9 +0.9 Independent Safia Ilyas 86 2.5 +2.5 Majority 1,082 31.6 43.2 −11.6 Turnout 3,419 28.6 33.6 −5 Labour hold Swing
Wakefield North ward Wakefield North Party Candidate Votes % ±% Labour Elizabeth Rhodes 1,901 61.0 +10.1 UKIP Keith Wells 594 19.1 +8.8 Conservative Dianne Presha 451 14.5 −10.5 Liberal Democrats Rob Bell 170 5.5 −1.6 Majority 1,307 41.9 −9.7 Turnout 3,116 27.6 −5.2 Labour hold Swing
Wakefield Rural ward Wakefield Rural Party Candidate Votes % ±% Labour Lawrence Kirkpatrick 2,003 43.5 +0.9 Conservative Tom Fletcher 1,778 38.6 −5.4 Green Miriam Hawkins 472 10.2 +2.5 Liberal Democrats Dennis Cronin 354 7.7 +2.7 Majority 225 4.9 +6.3 Turnout 4,607 34 −6.3 Labour gain from Conservative Swing
Wakefield South ward Wakefield South Party Candidate Votes % ±% Conservative David Hopkins 1,851 47.8 −6.9 Labour Javed Iqbal 1,562 40.3 +5.7 Liberal Democrats Stephen Nuthall 462 11.9 +1.8 Majority 289 7.5 −12.6 Turnout 3,875 36.1 −7.3 Conservative hold Swing
Wakefield West ward Wakefield West Party Candidate Votes % ±% Labour Hilary Mitchell 1,456 43.1 +4.2 Conservative Philip Booth 1,101 32.6 −7.5 English Democrat Norman Tate 594 17.6 +17.6 Green Brian Else 226 6.7 +1.4 Majority 355 10.5 Turnout 3,377 29.5 −5 Labour gain from Conservative Swing
Wrenthorpe and Outwood West ward Wrenthorpe and Outwood West Party Candidate Votes % ±% Labour Martyn Johnson 1,743 46.9 +2.3 Conservative Anne-Marie Glover 1,037 27.9 −7.9 UKIP David Dews 940 25.3 +11.9 Majority 706 19 +10.4 Turnout 3,720 31.8 −7.6 Labour gain from Conservative Swing
References ^ "Local election results 2010". Wakefield Council. Archived from the original on 9 May 2011. Retrieved 23 April 2012 . ^ "District Council Election Results 2011". Wakefield Council. Archived from the original on 2 April 2012. Retrieved 23 April 2012 . ^ "Local election results 2012". Wakefield Council. Archived from the original on 3 September 2012. Retrieved 5 May 2021 .
 Council elections in West Yorkshire


